Palantir: Foundry Data Health
Palo Alto & London, Oct 2016 - Present
data health alerts you of anomalies in your data
Palantir Foundry is a "big data" operating system that allows users to integrate and collaboratively analyze, transform, and manage massive amounts of data. It helps answer questions like:
How can I improve the efficiency of my airplane manufacturing process?
How can I best take advantage of chemical data to more effectively produce pharmaceutical products?
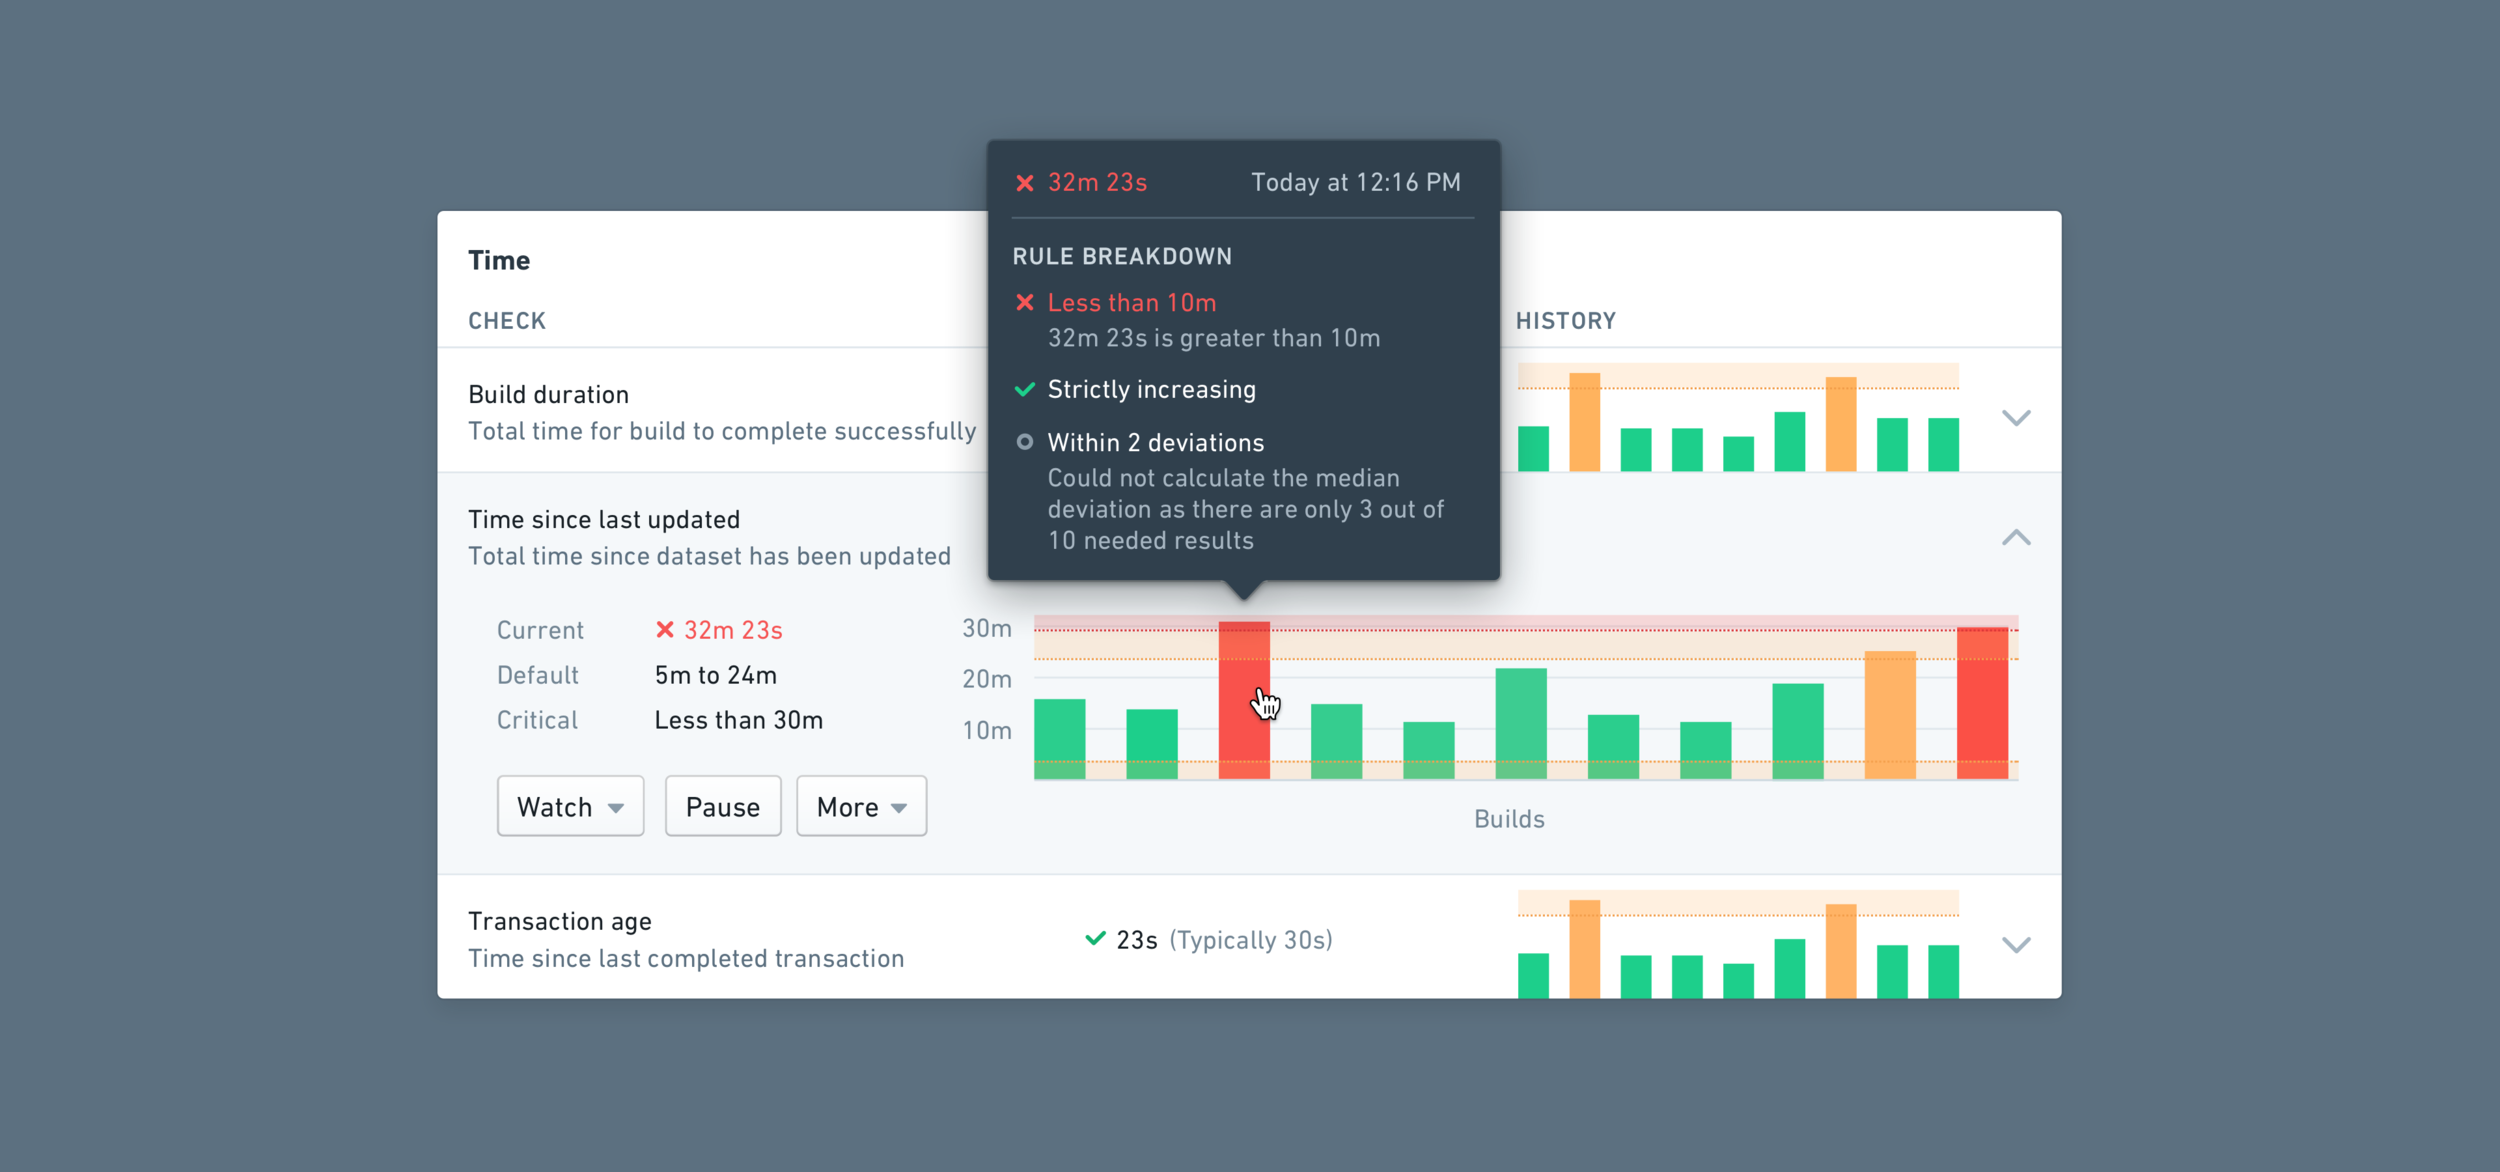
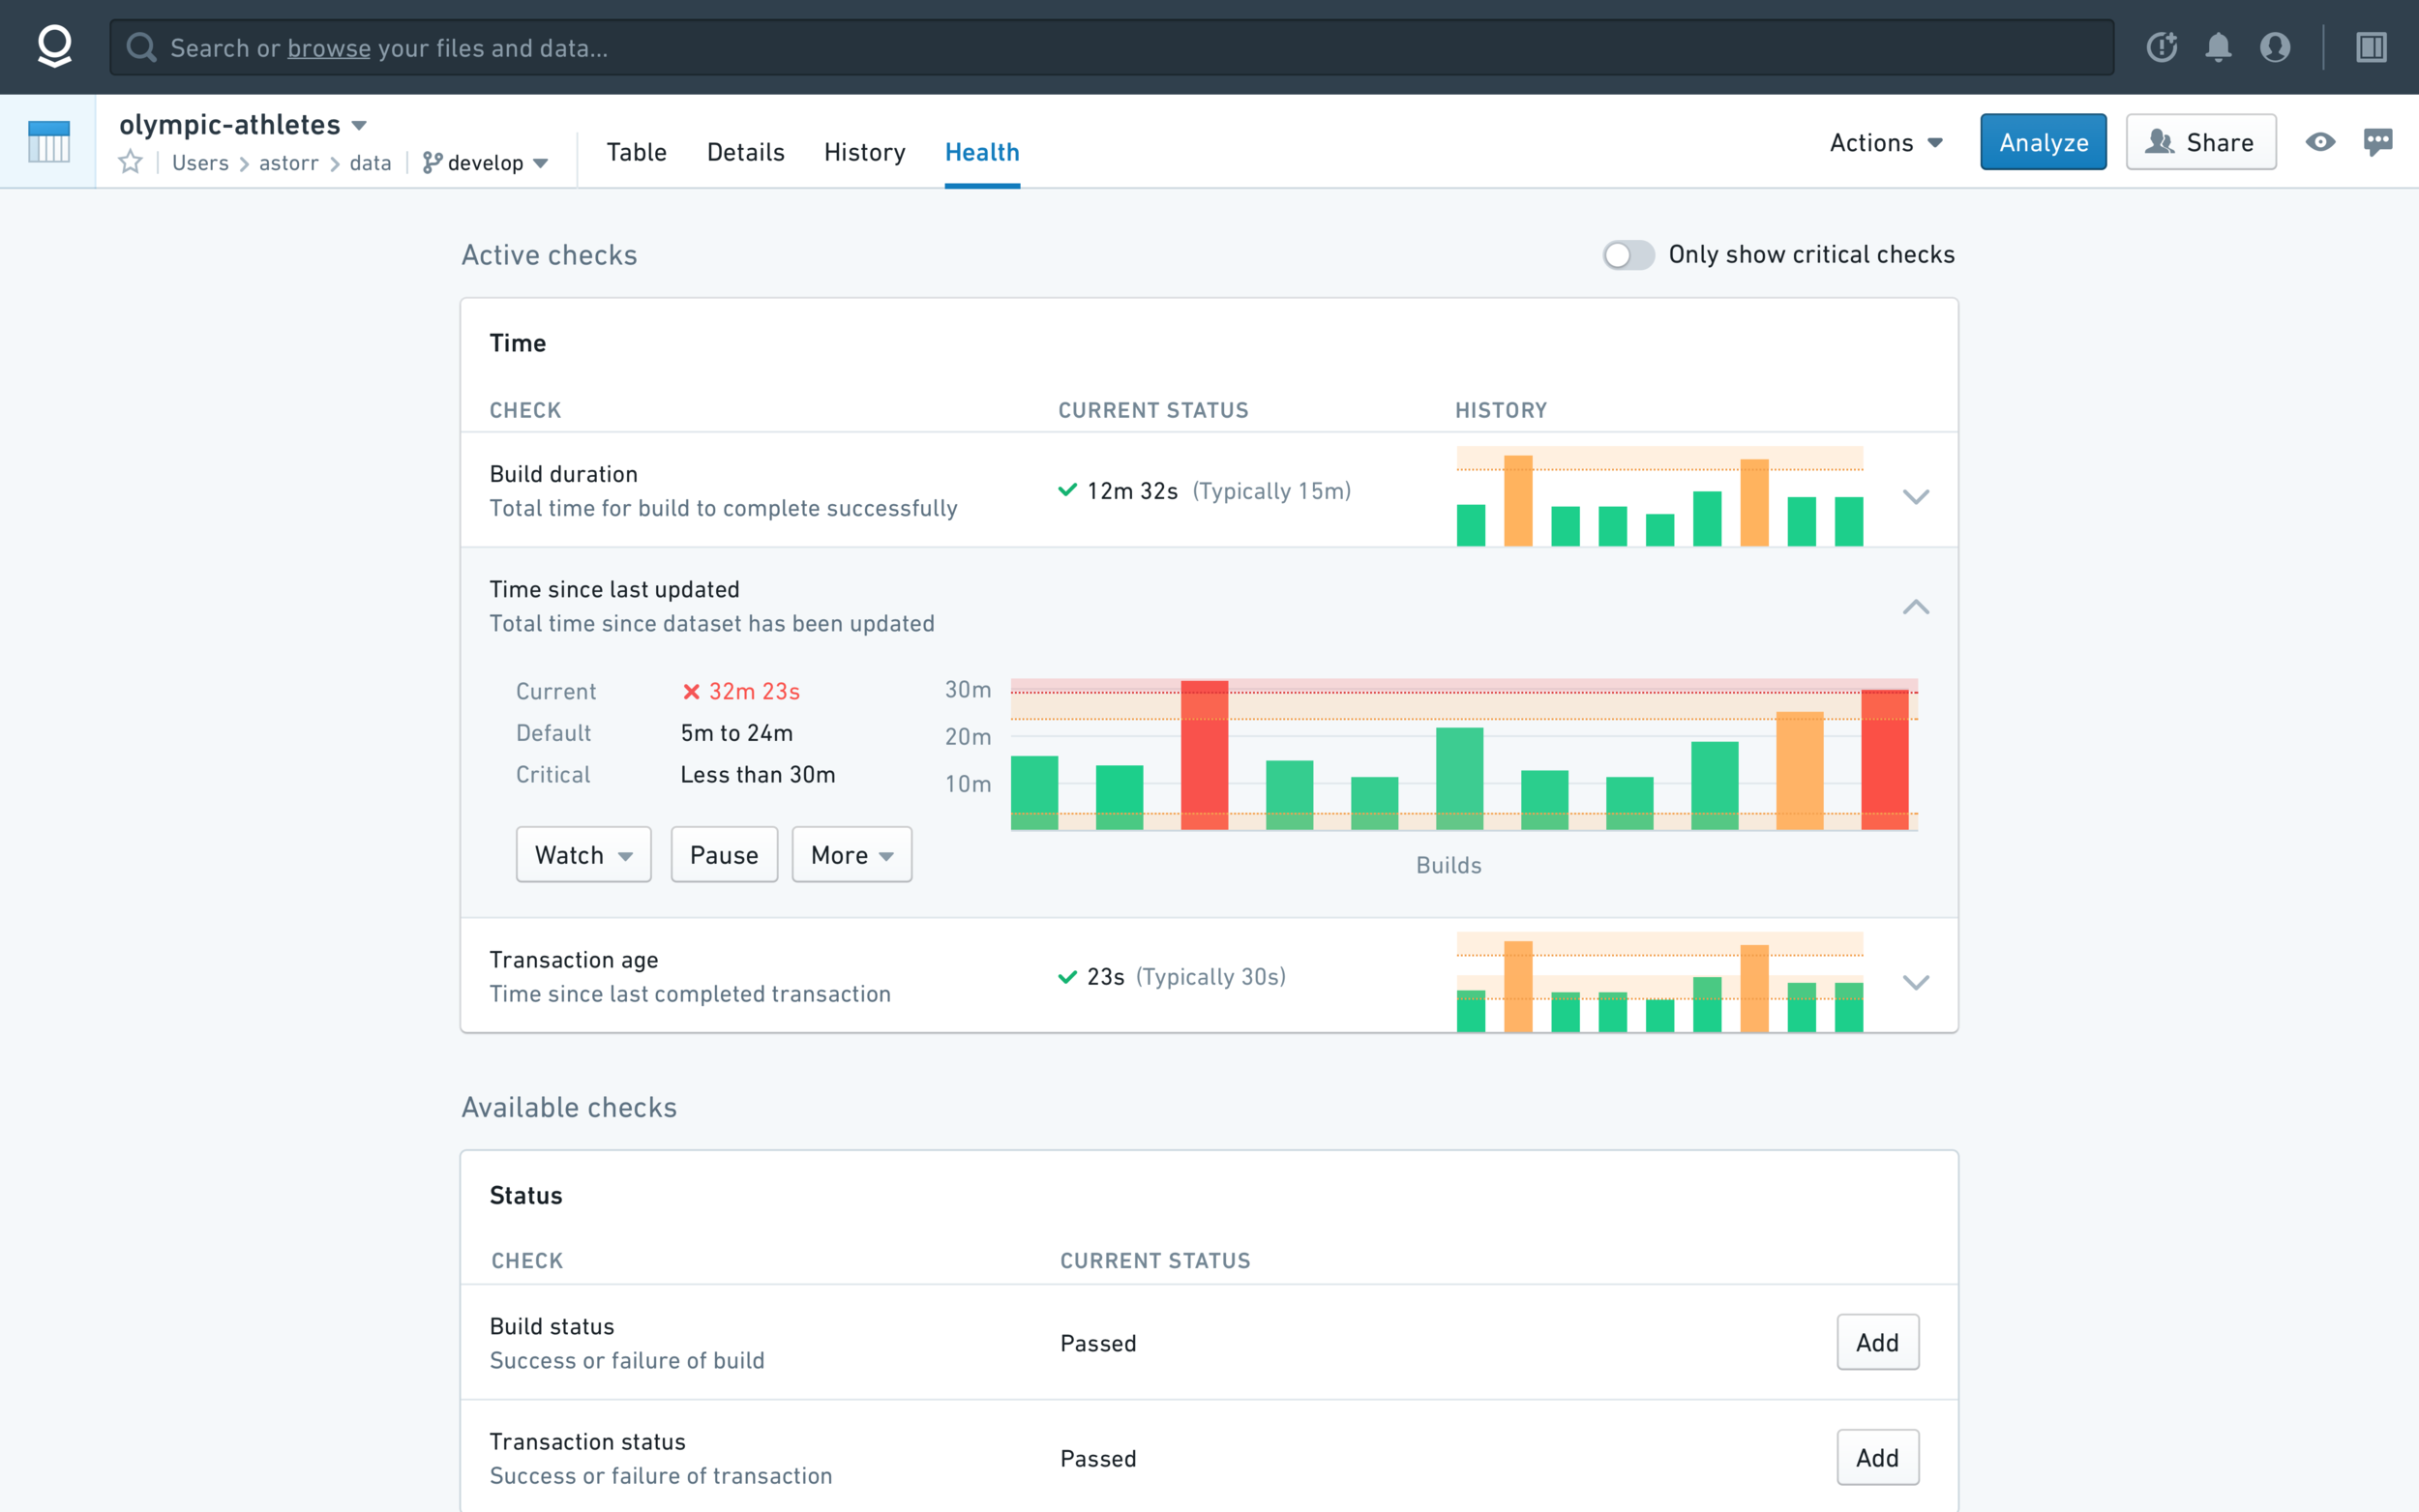
Within Foundry, one of the products I designed and continually manage is Data Health, a monitoring tool that alerts you of anomalies in your data based on thresholds you set.
Often times, datasets take hours to days to update based on a "pipeline" of chained datasets that rely on each other. Before Data Health, these pipeline engineers had little to no awareness on how long these pipelines take to update (often managing 50-60 at a time), how healthy they are, and what their ultimate status is (whether it passed or failed).
Data Health solves this problem by explicitly warning these users when things go wrong and when to pay attention to a particularly problematic pipeline. The screenshot below is what Data Health looks like today.
process
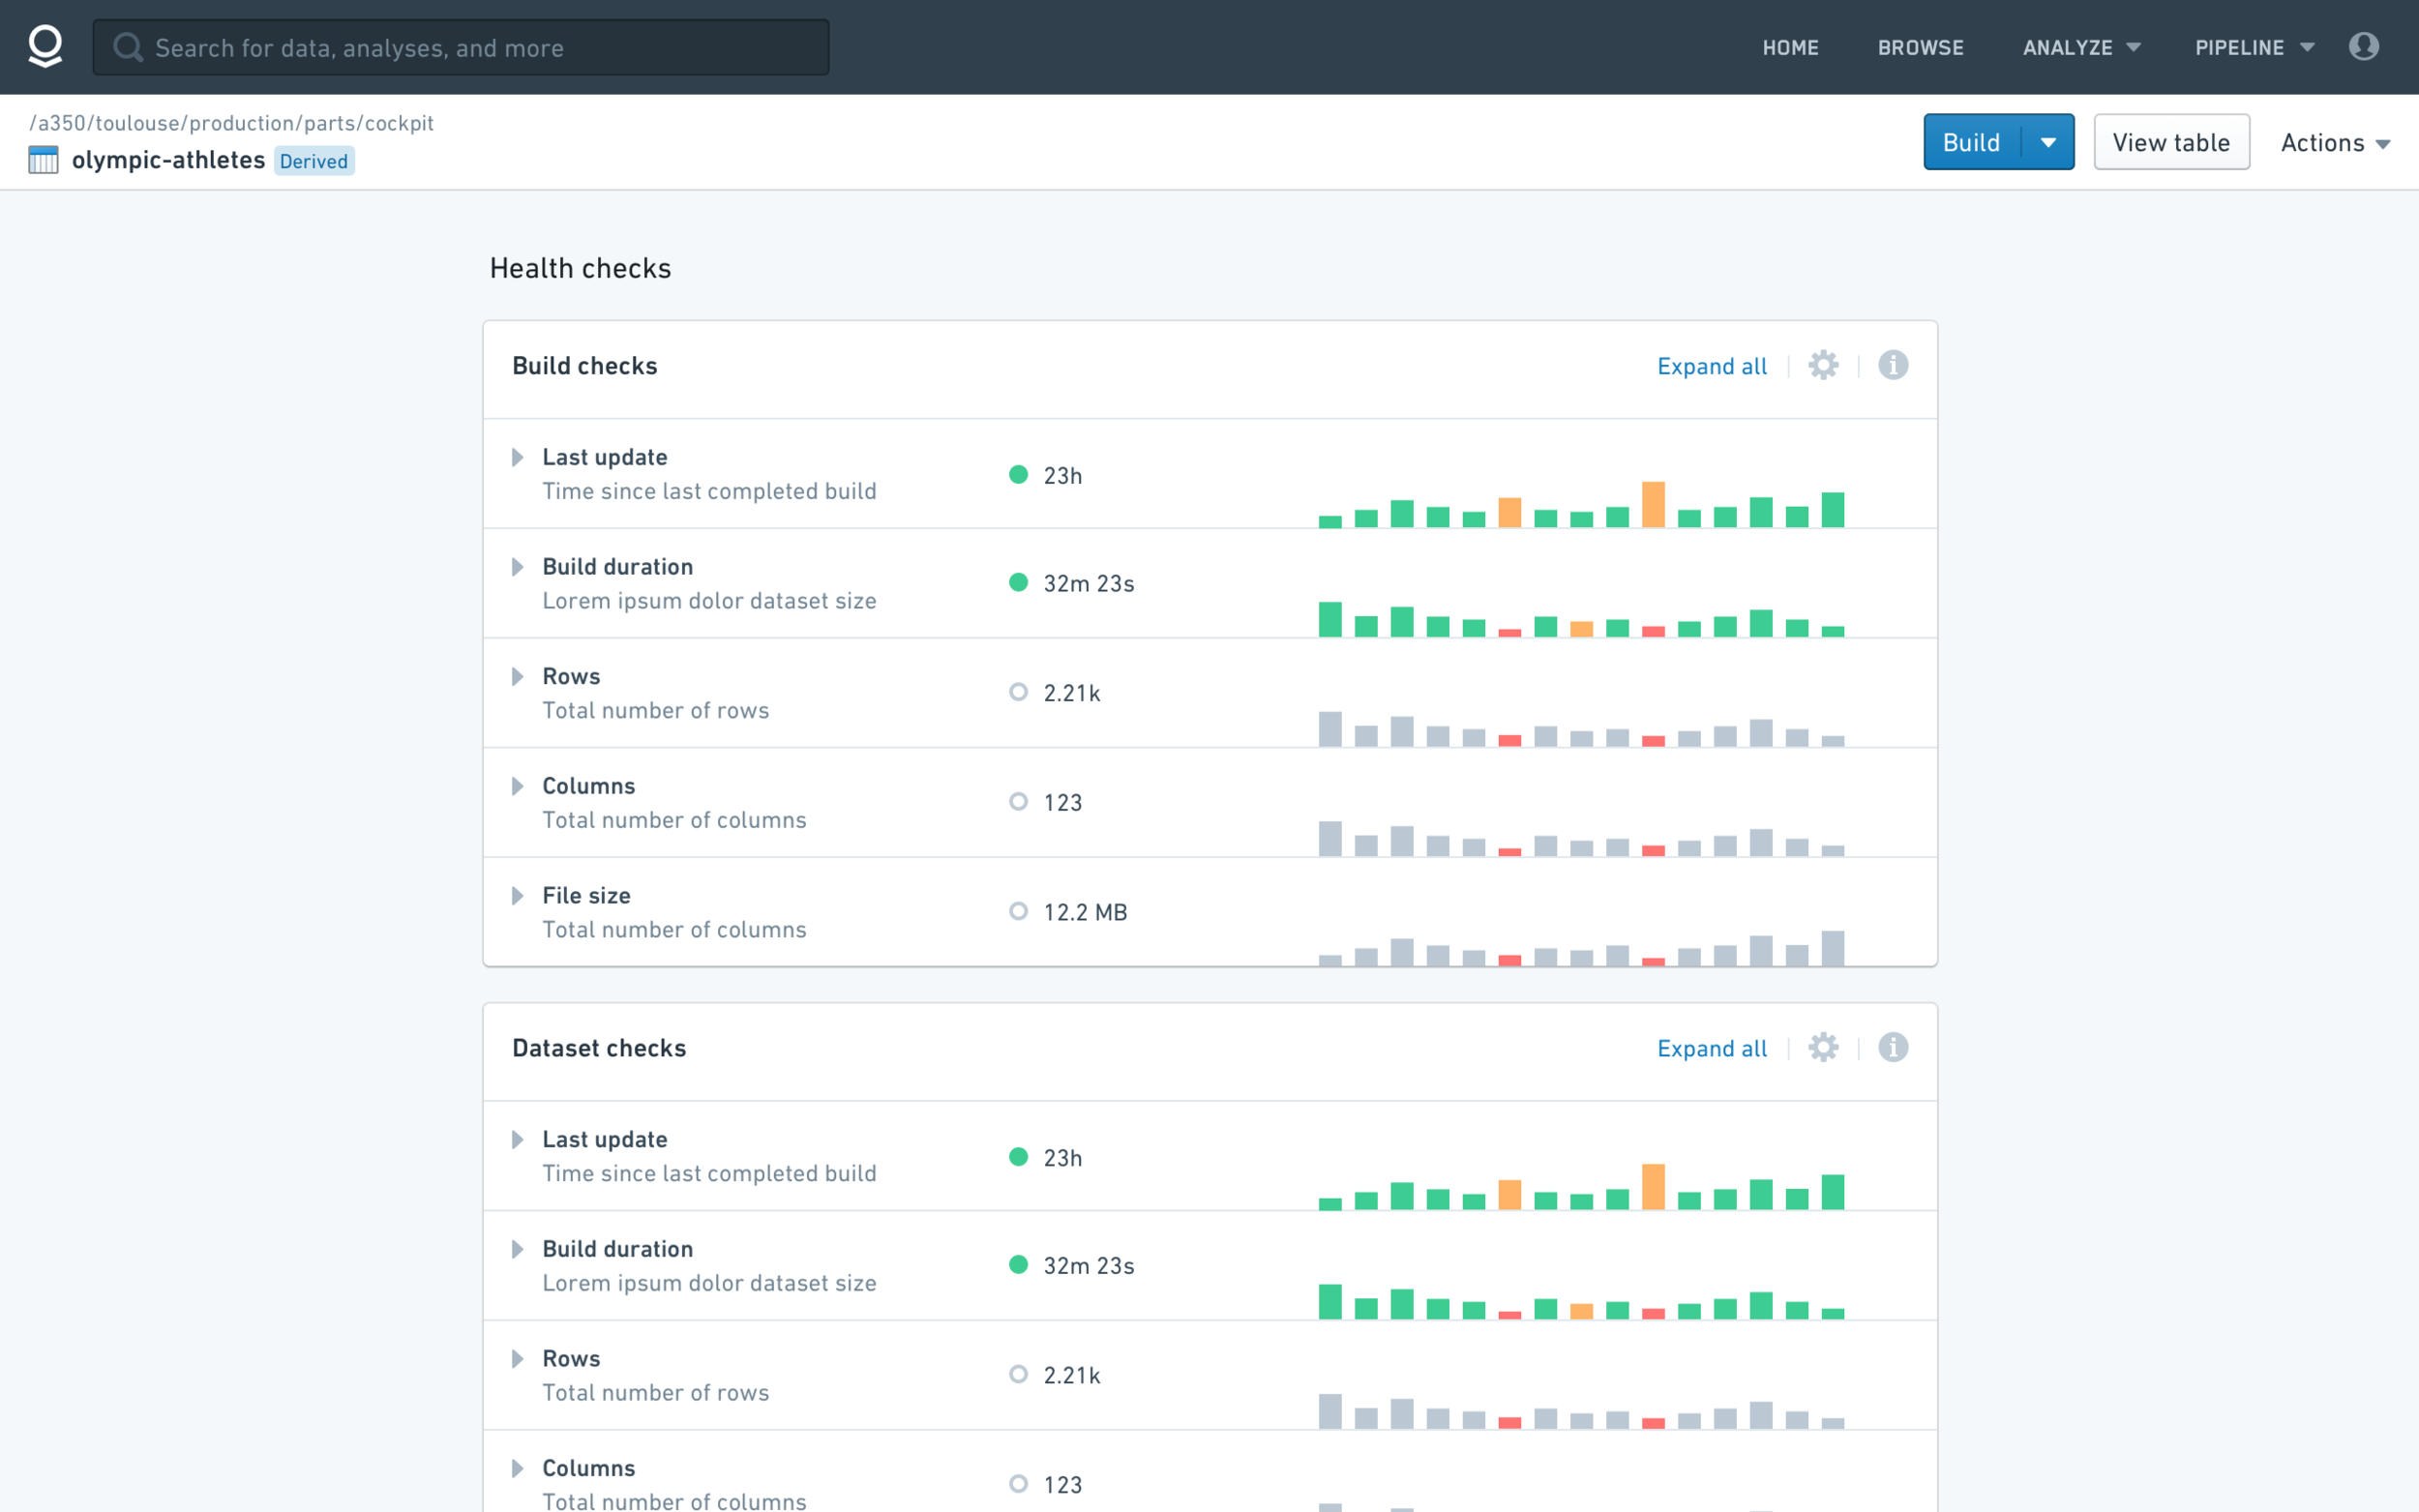
The first question we answered was, "Where does Data Health live in the vast ecosystem that is Foundry?" It could've been a separate "app", but ultimately we felt it made sense to live as an integrated component within Dataset App, a view that houses data in tabular format, the most atomic unit of data within Foundry (users don't see Foundry as a series of separate apps, but rather as a single, cohesive experience). Below are a few explorations I did on what a list of checks would look like for a given dataset.
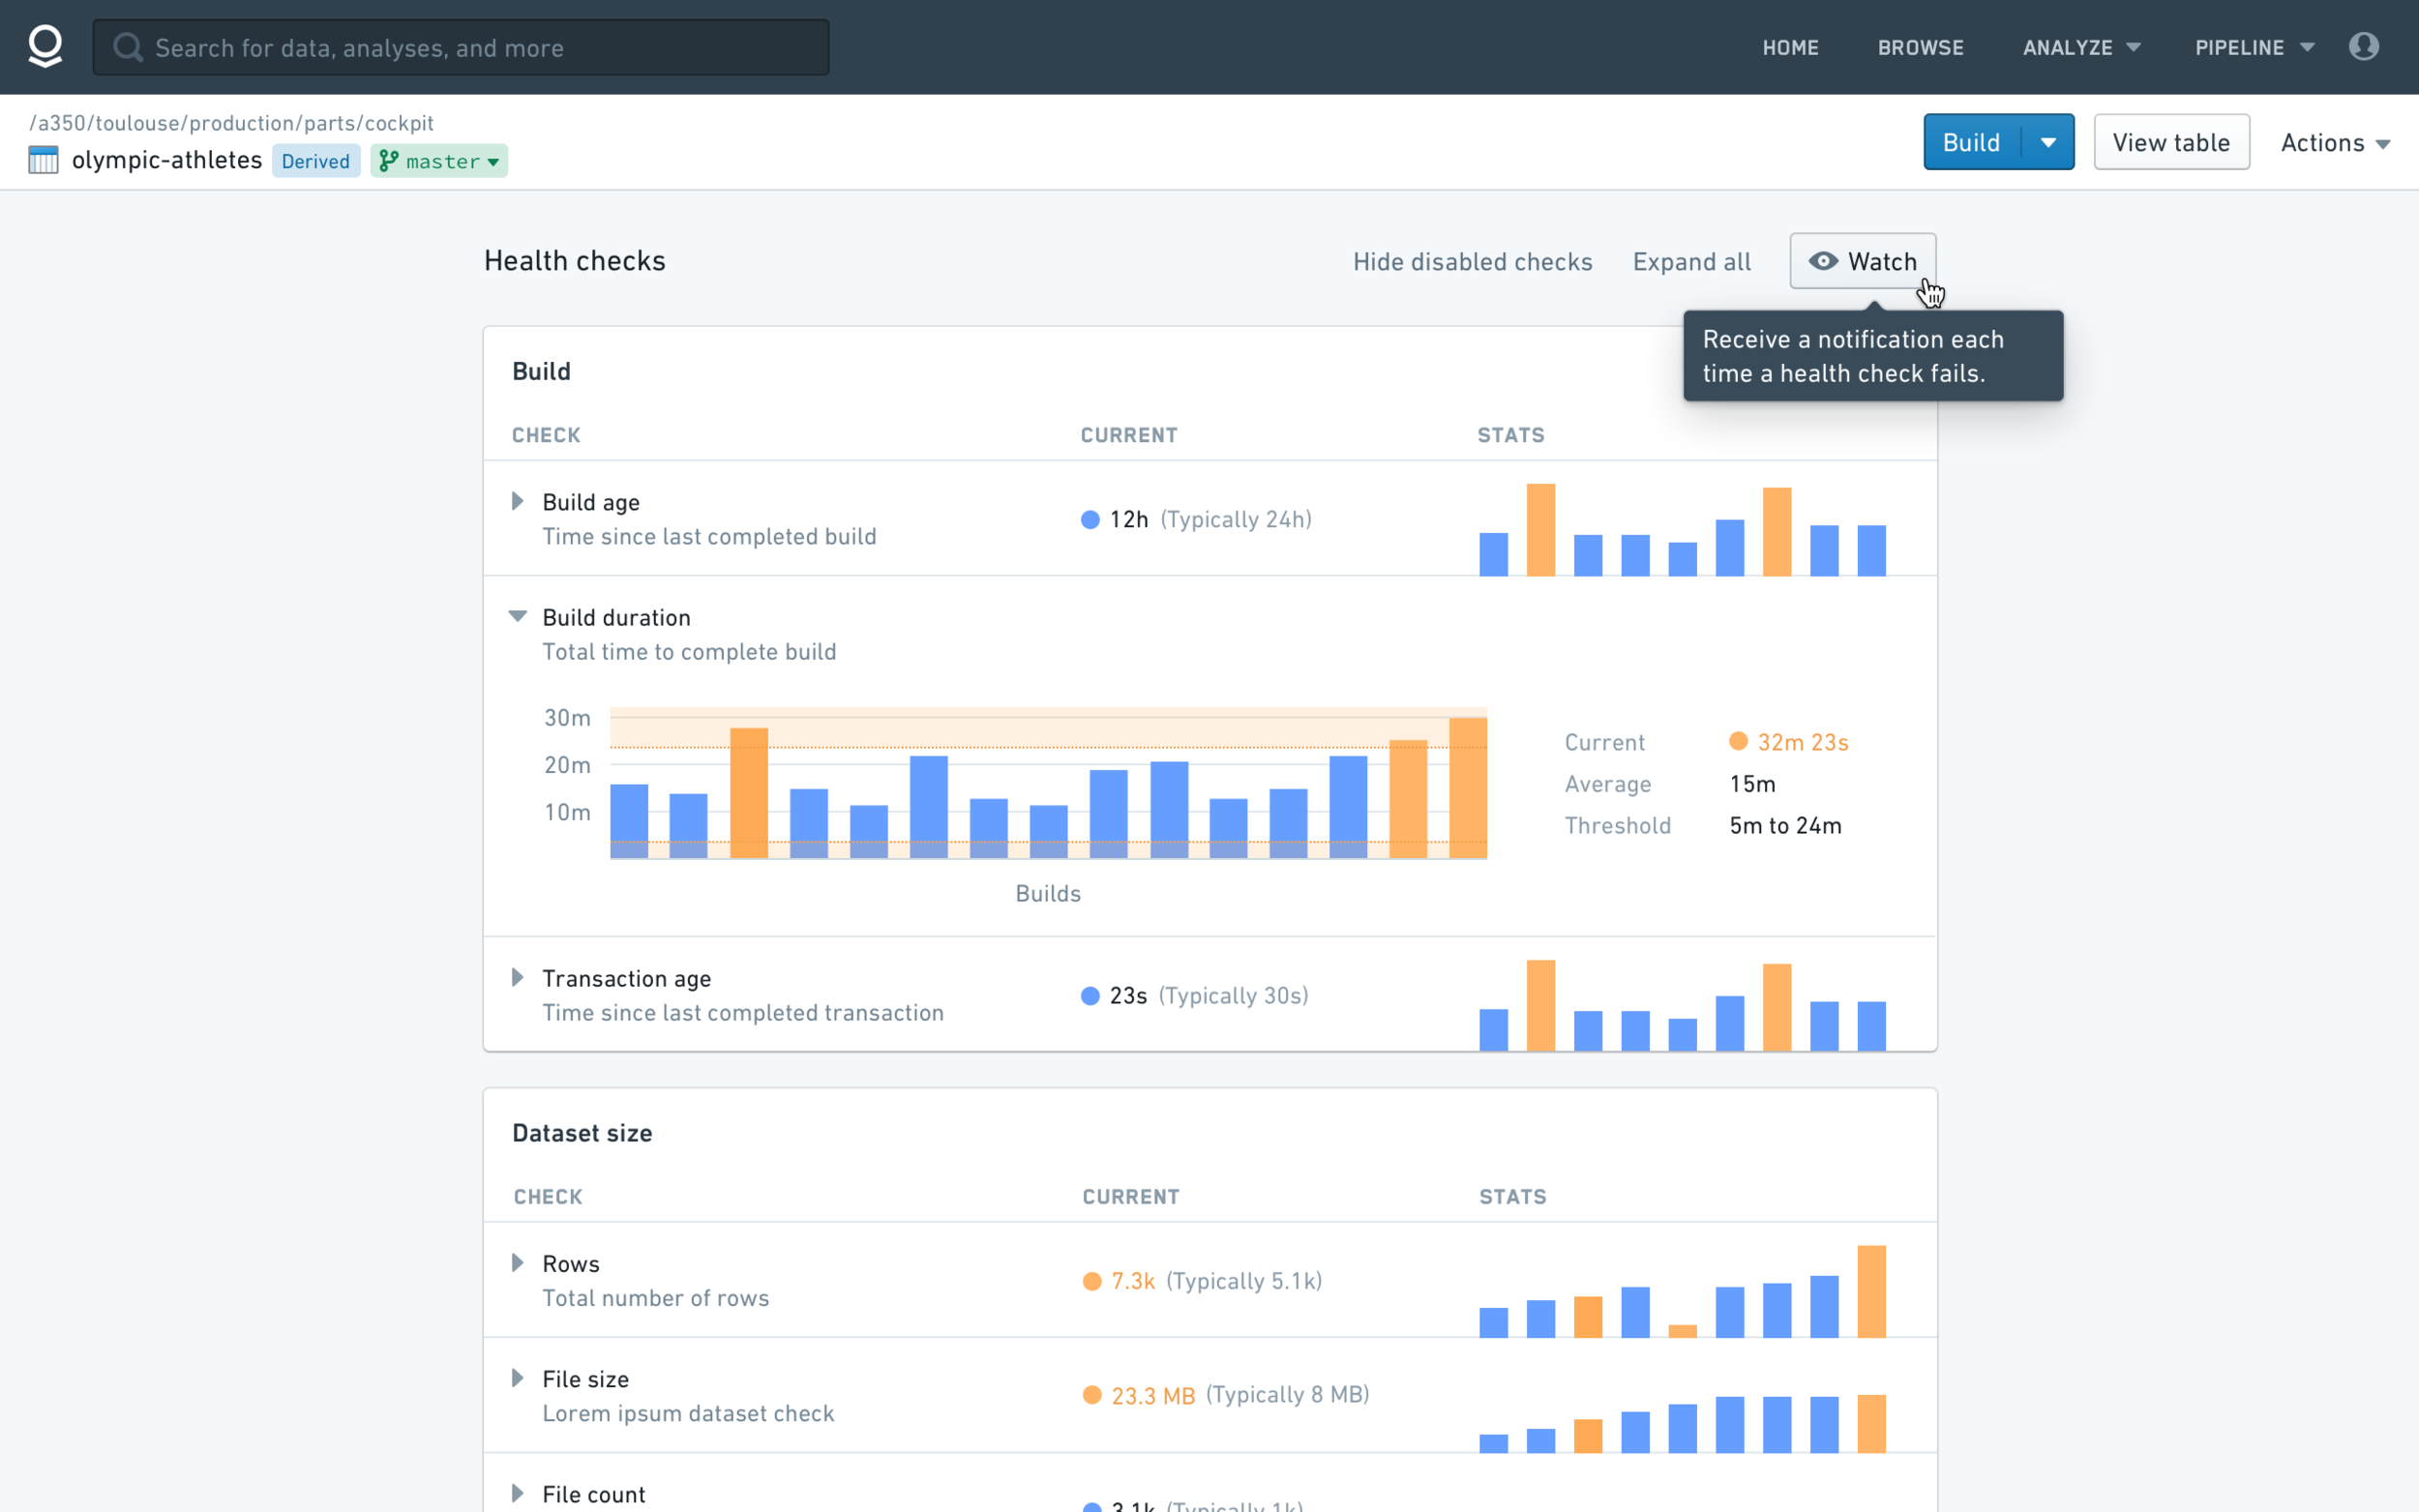
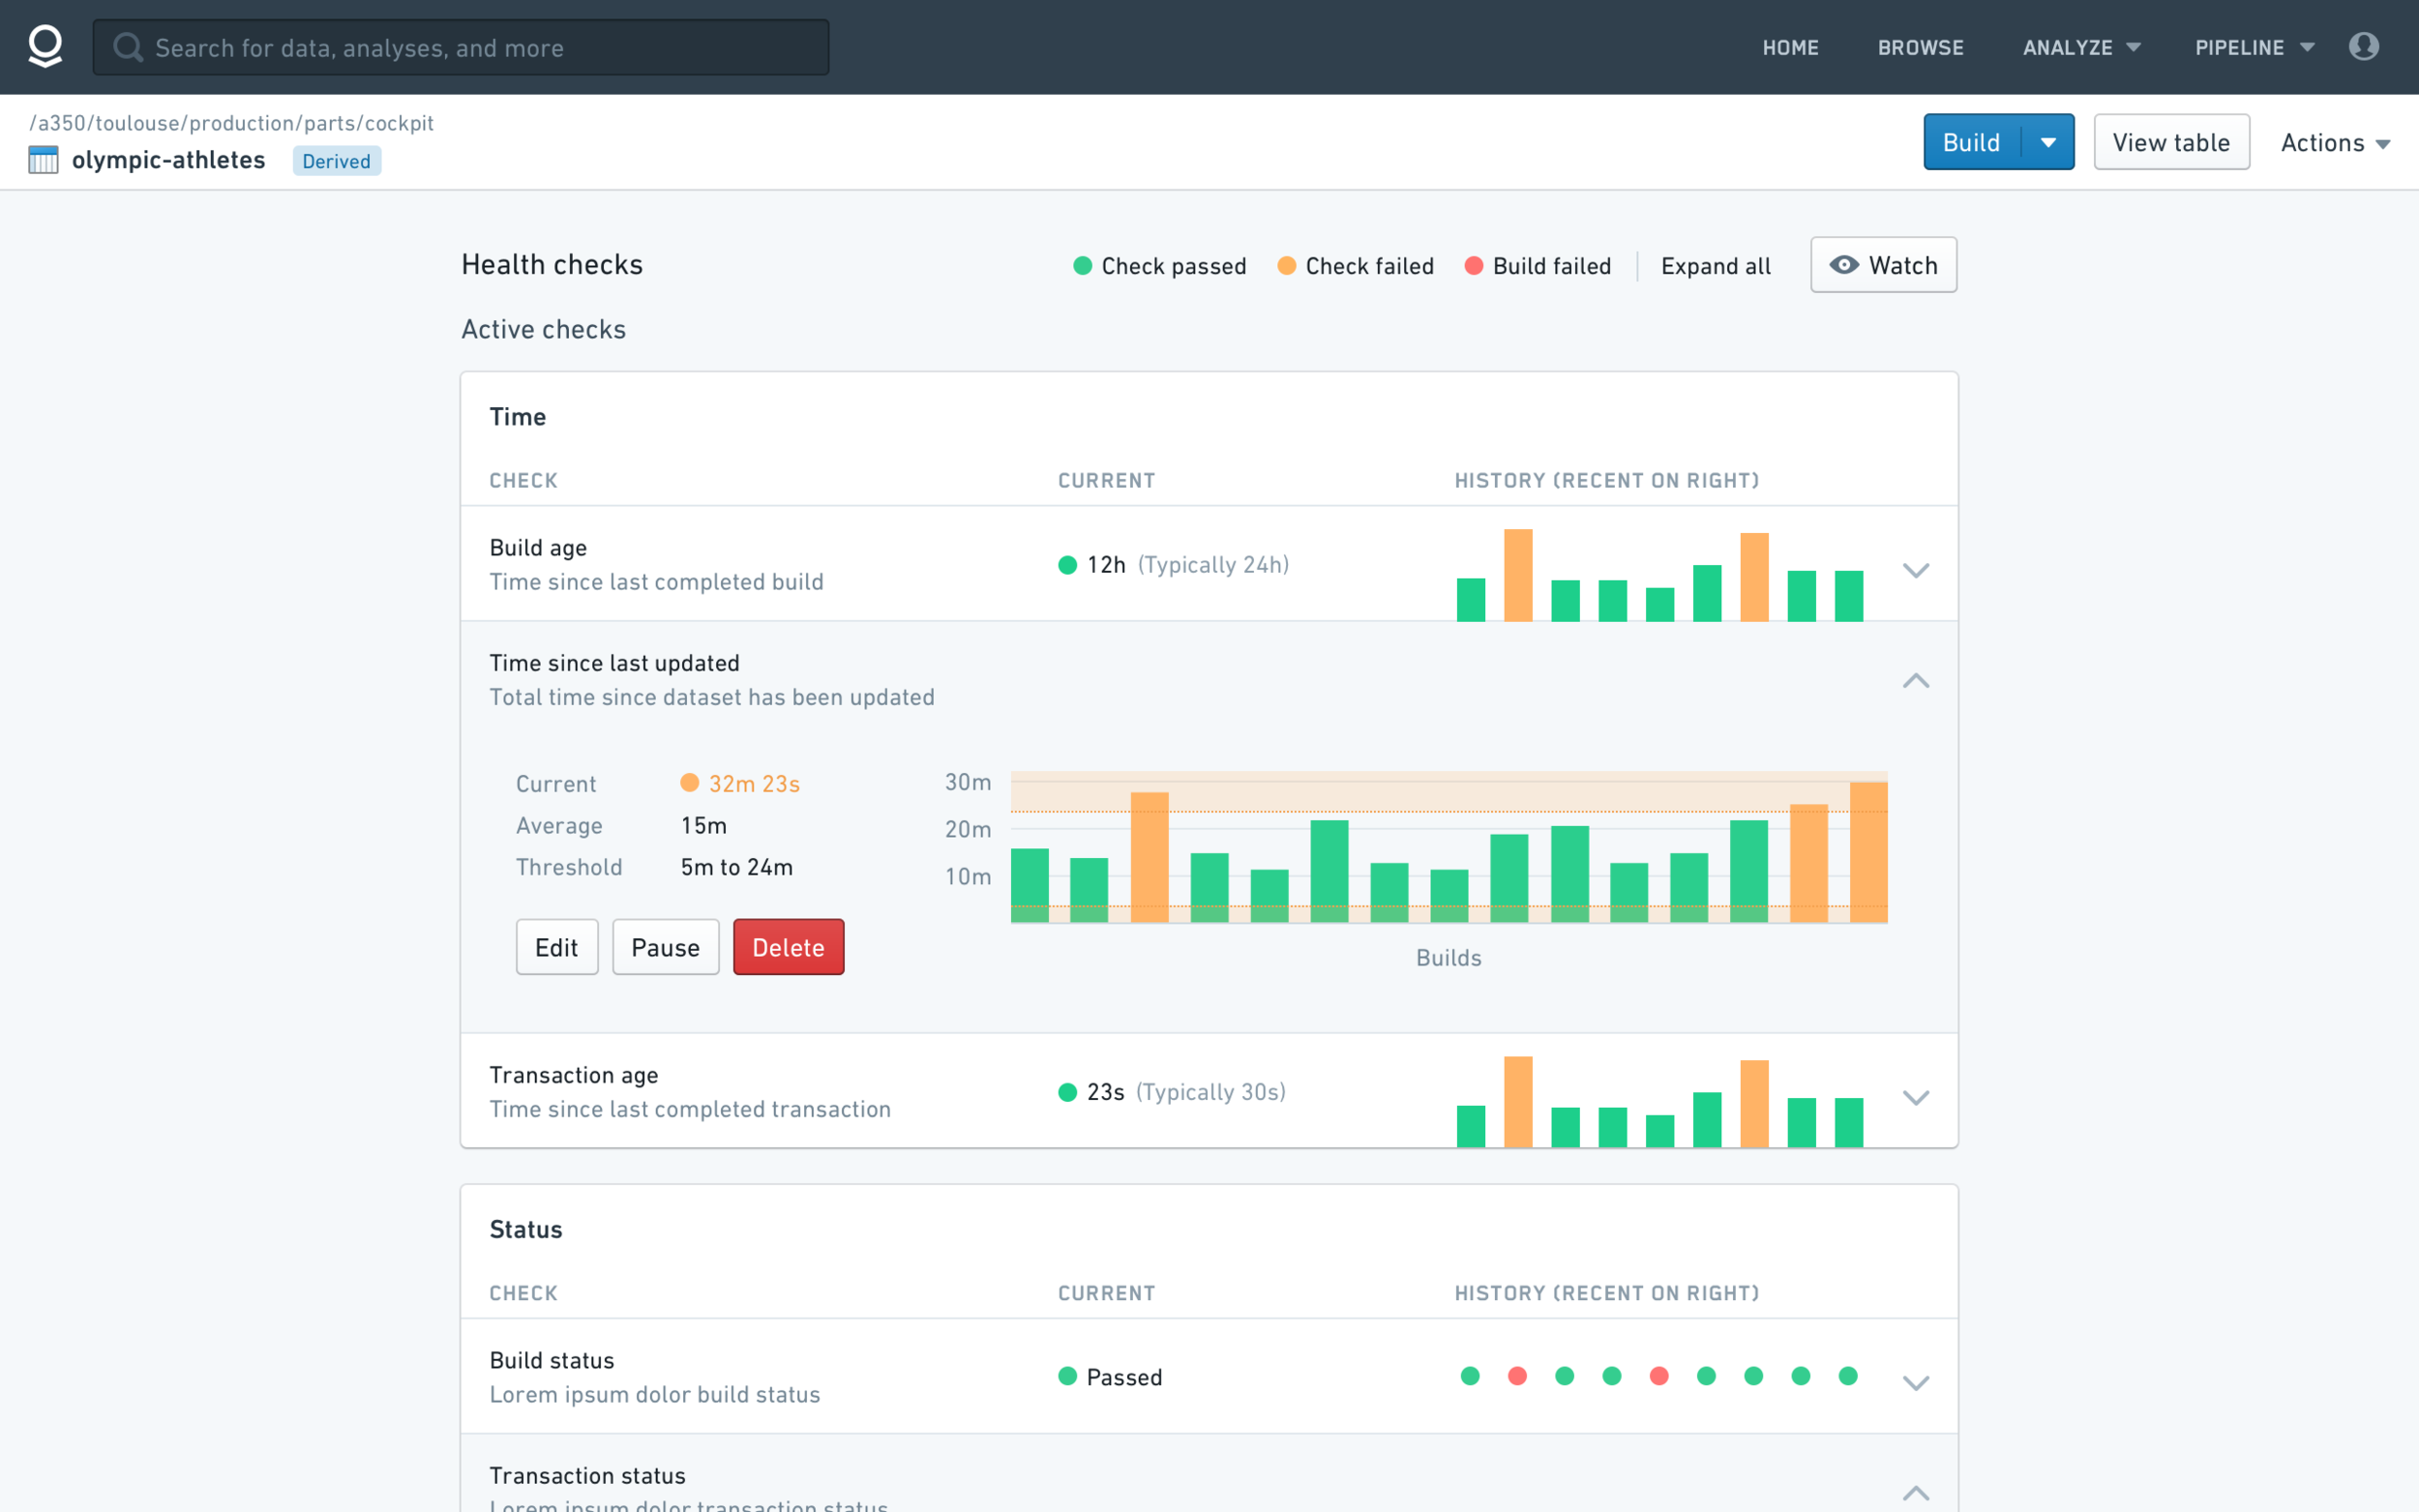
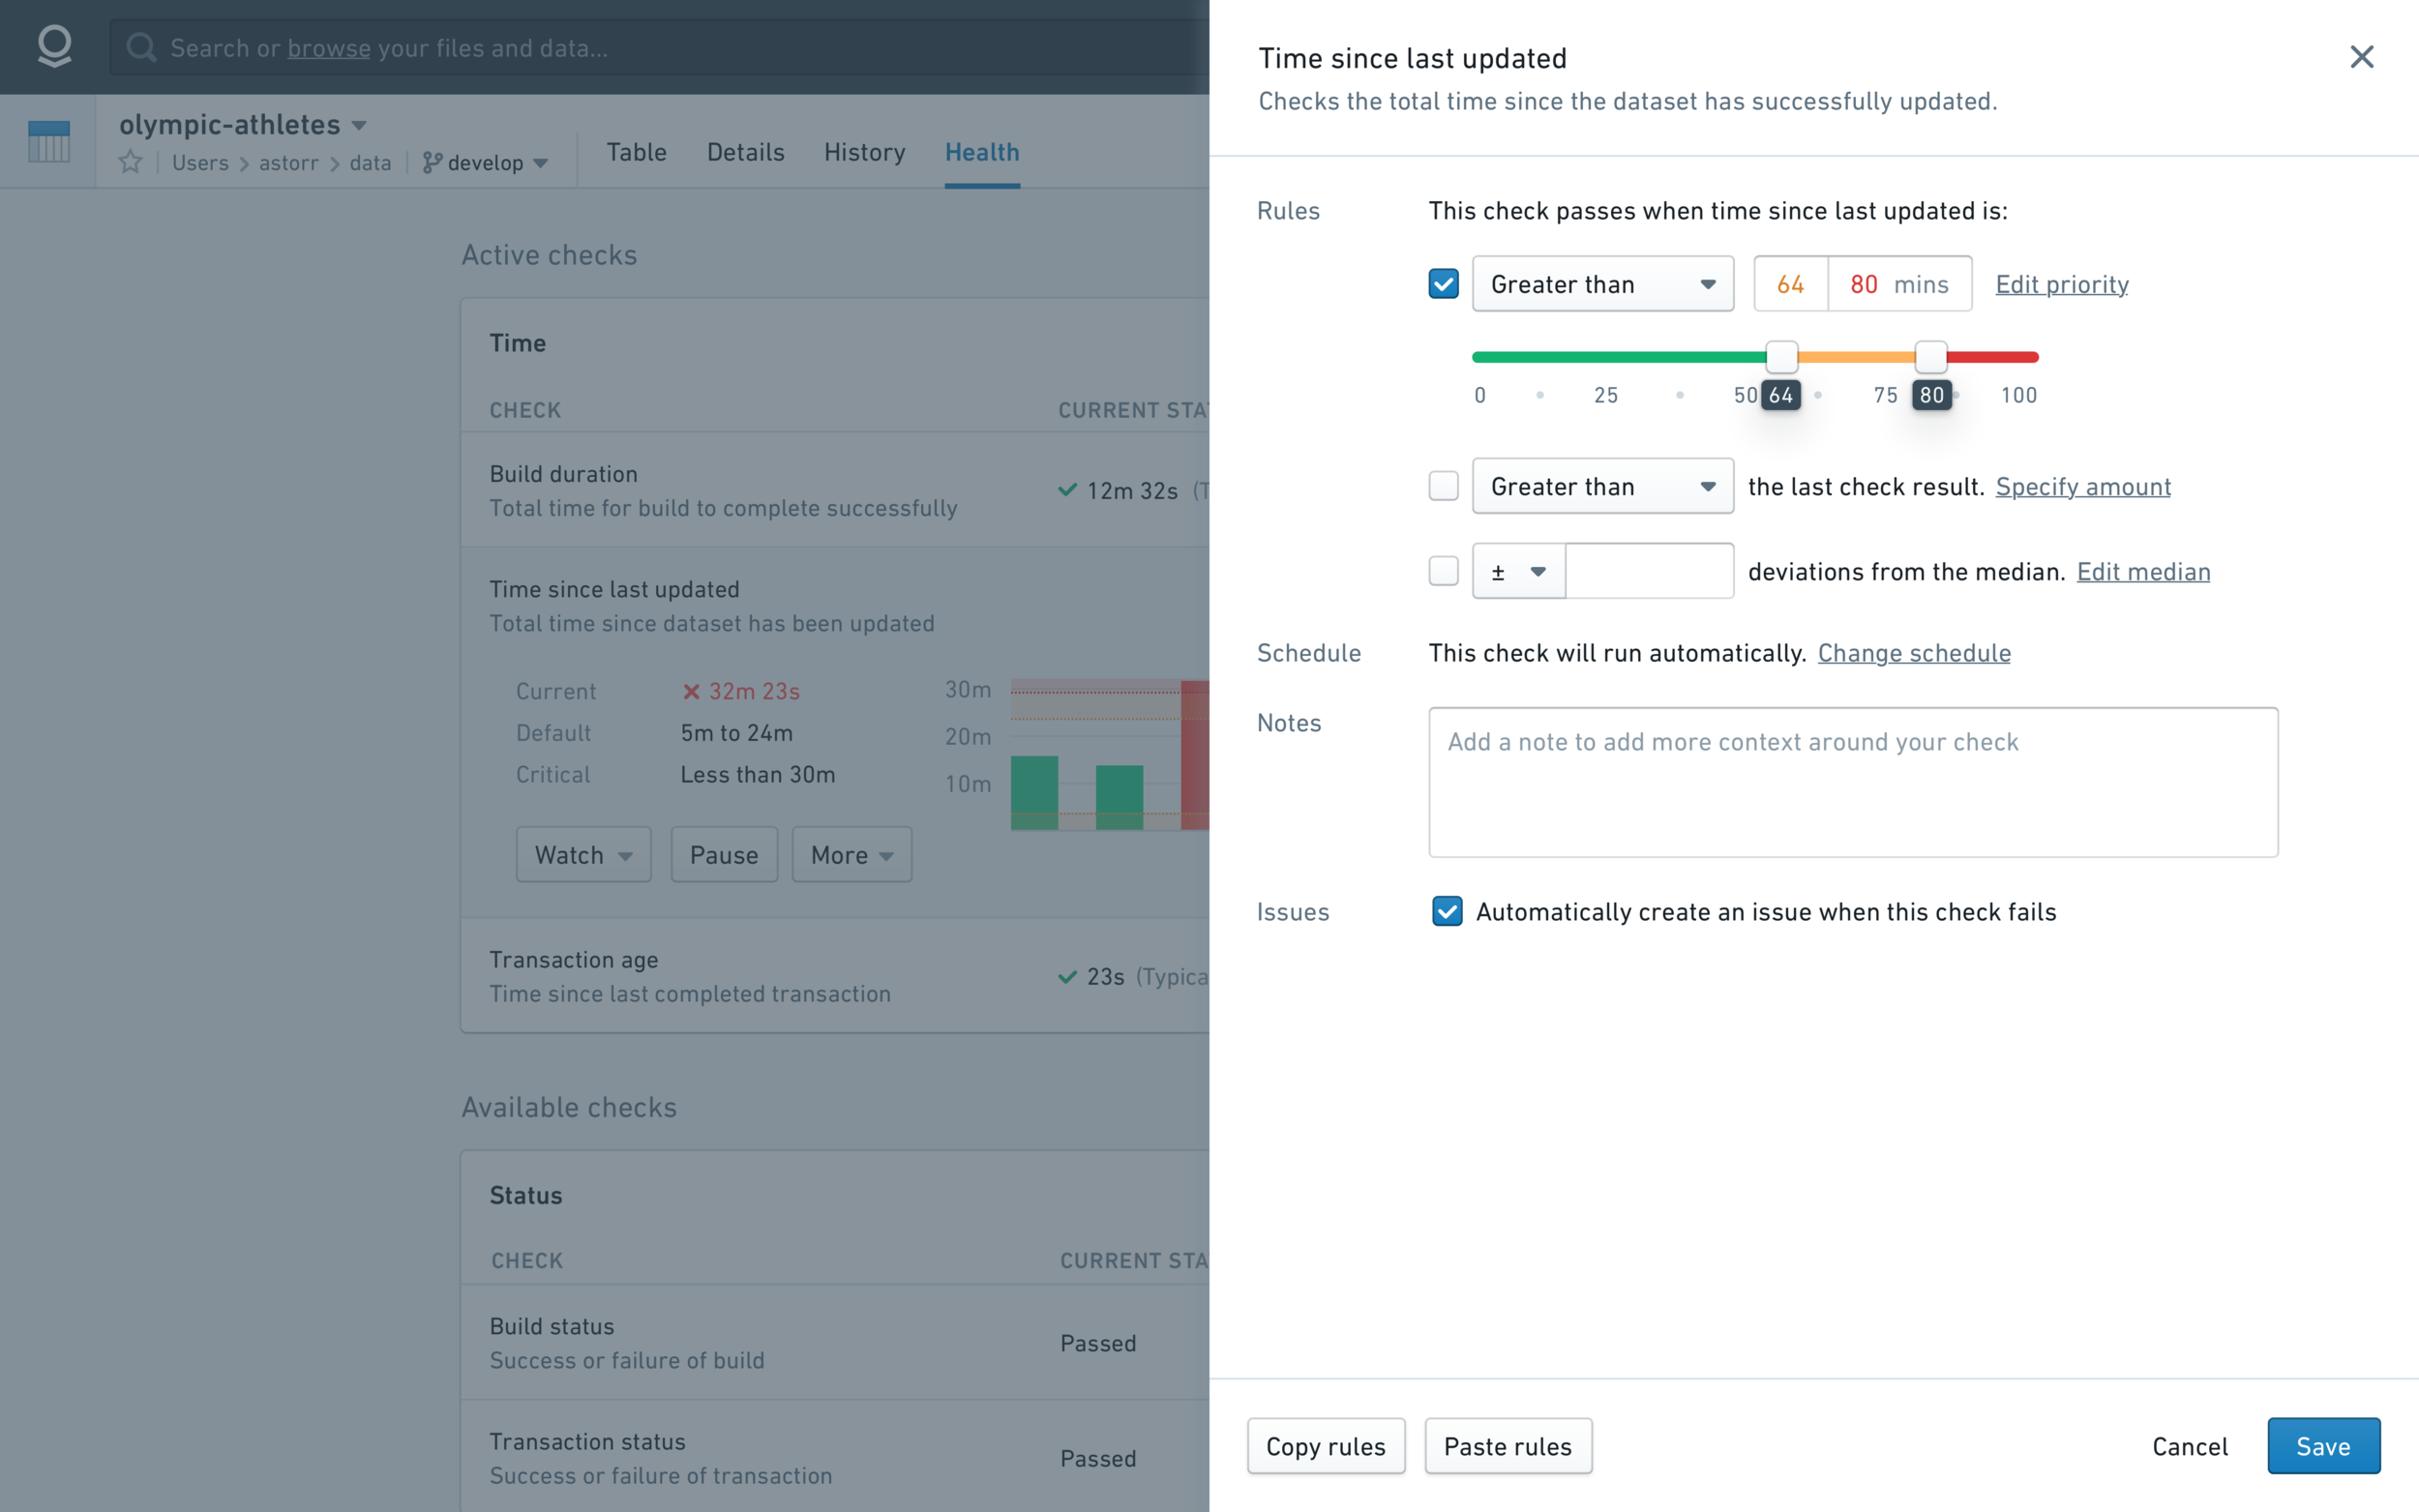
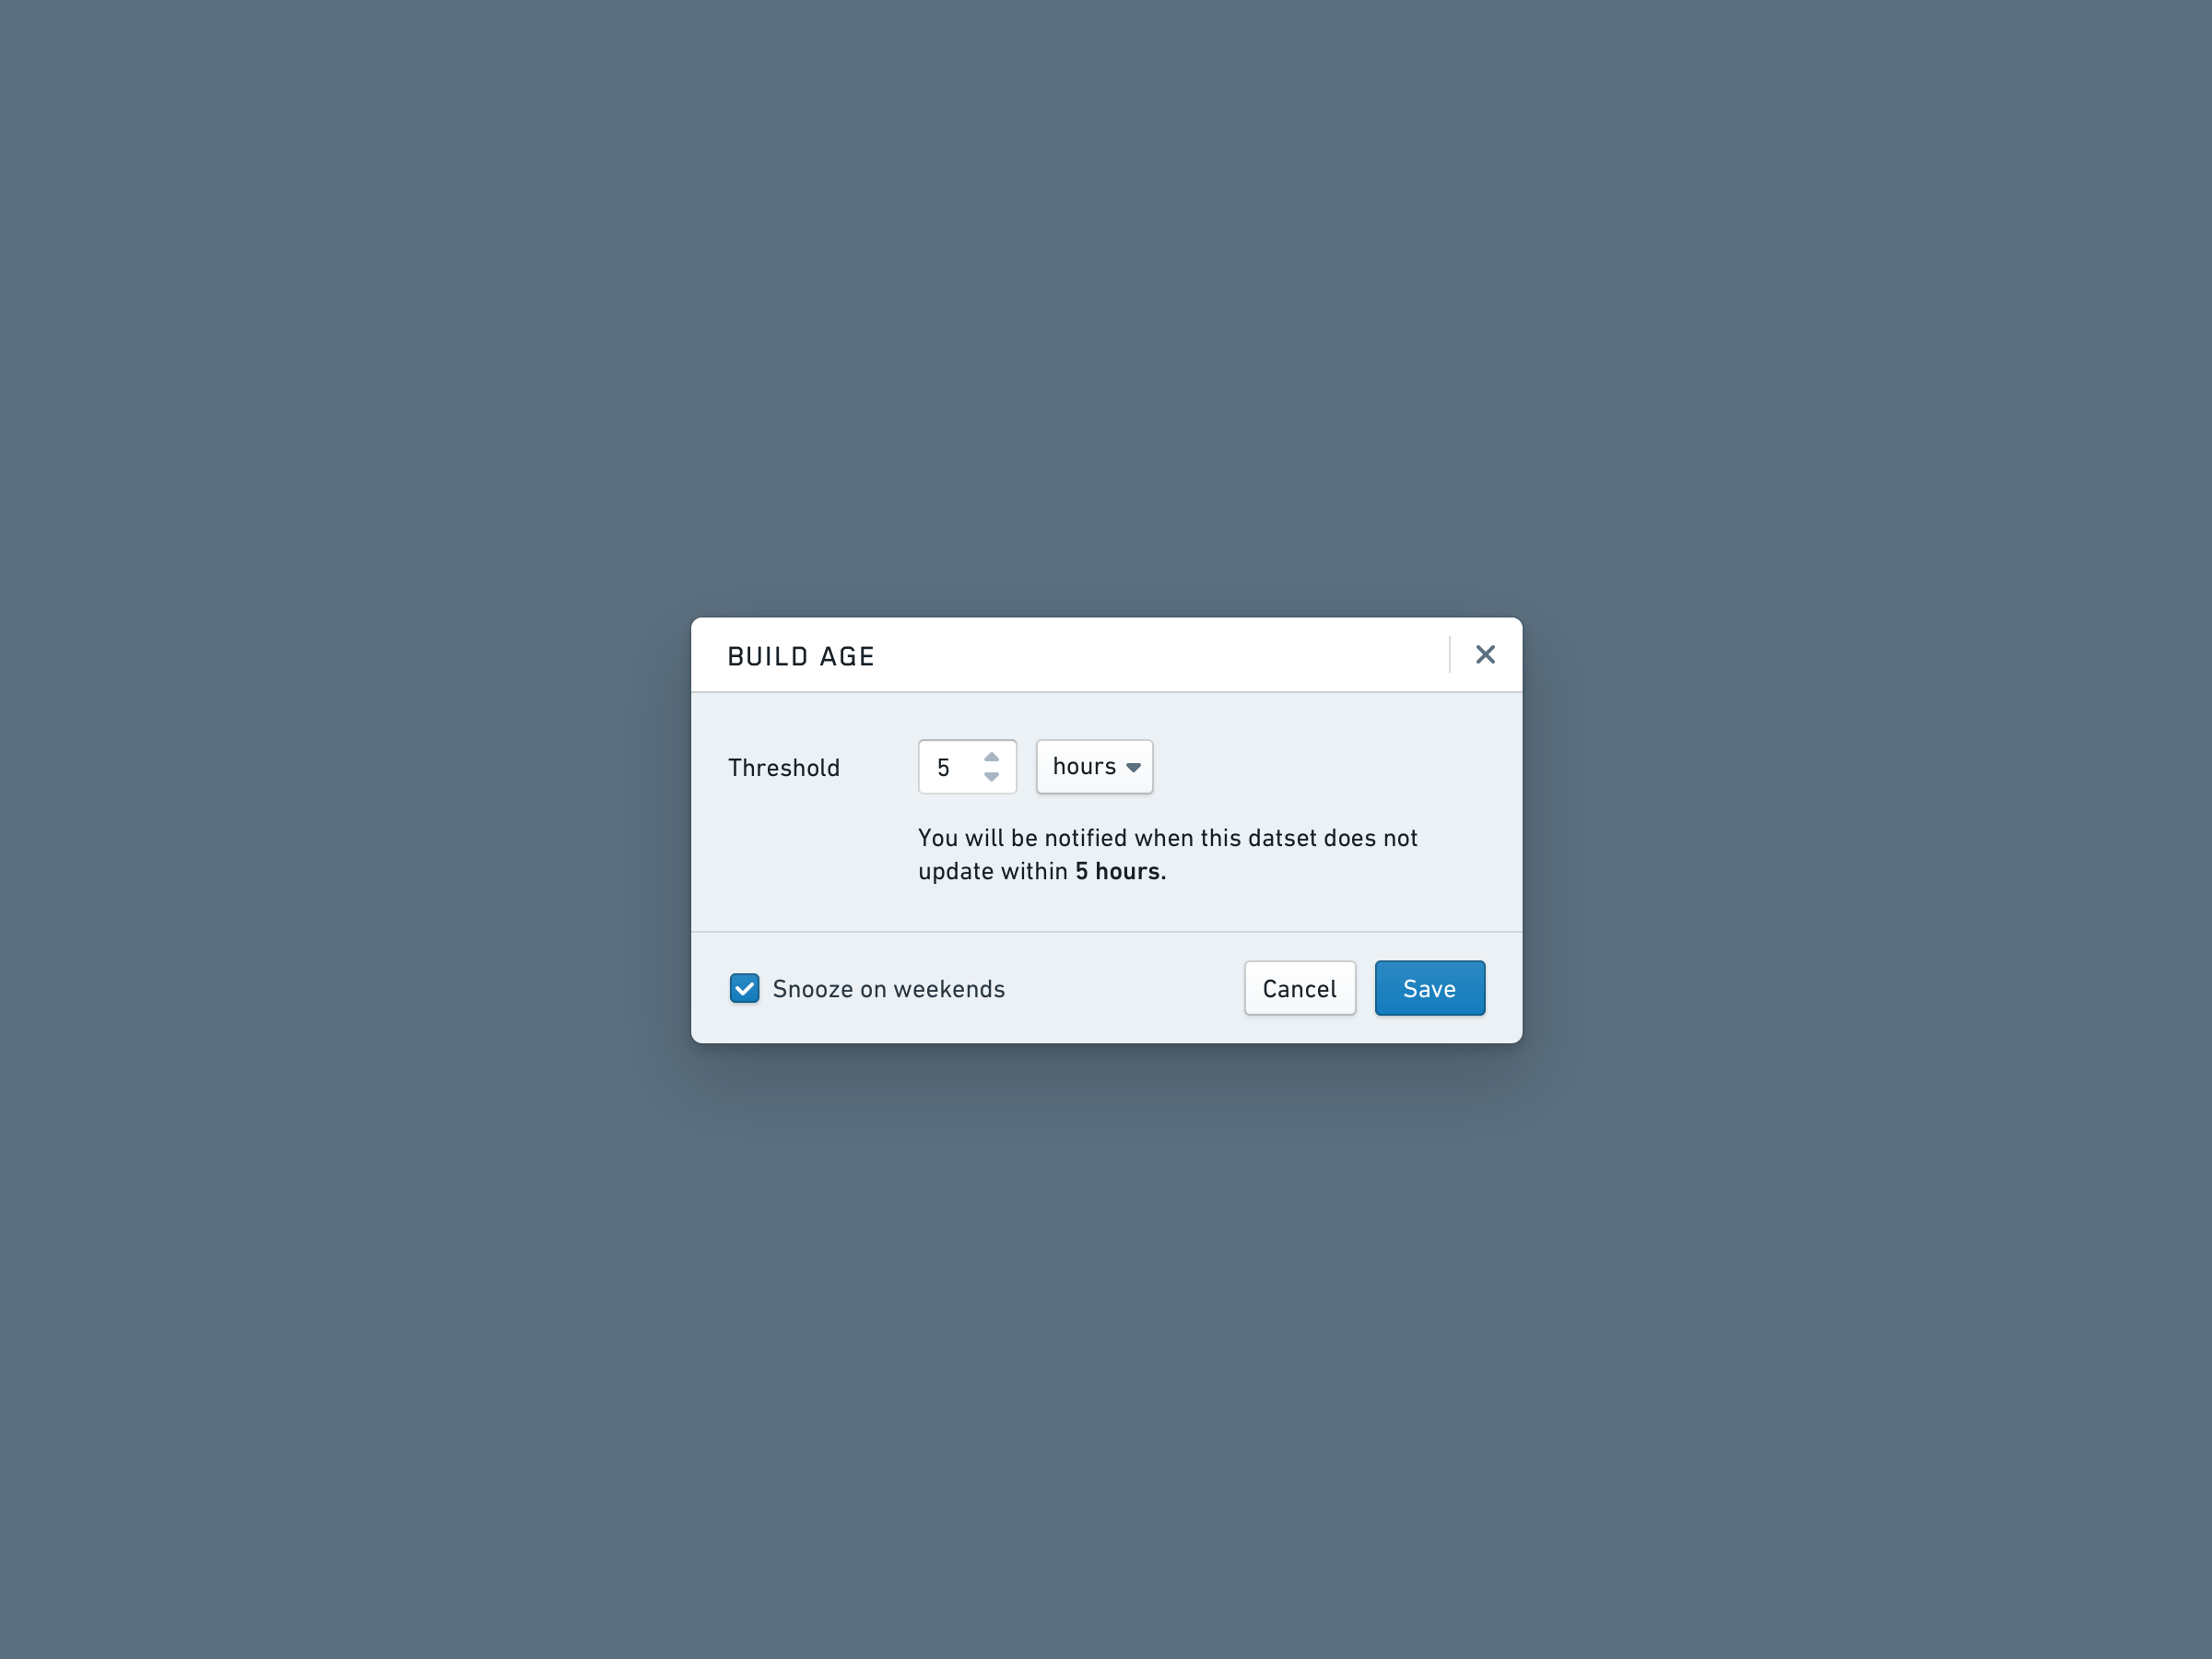
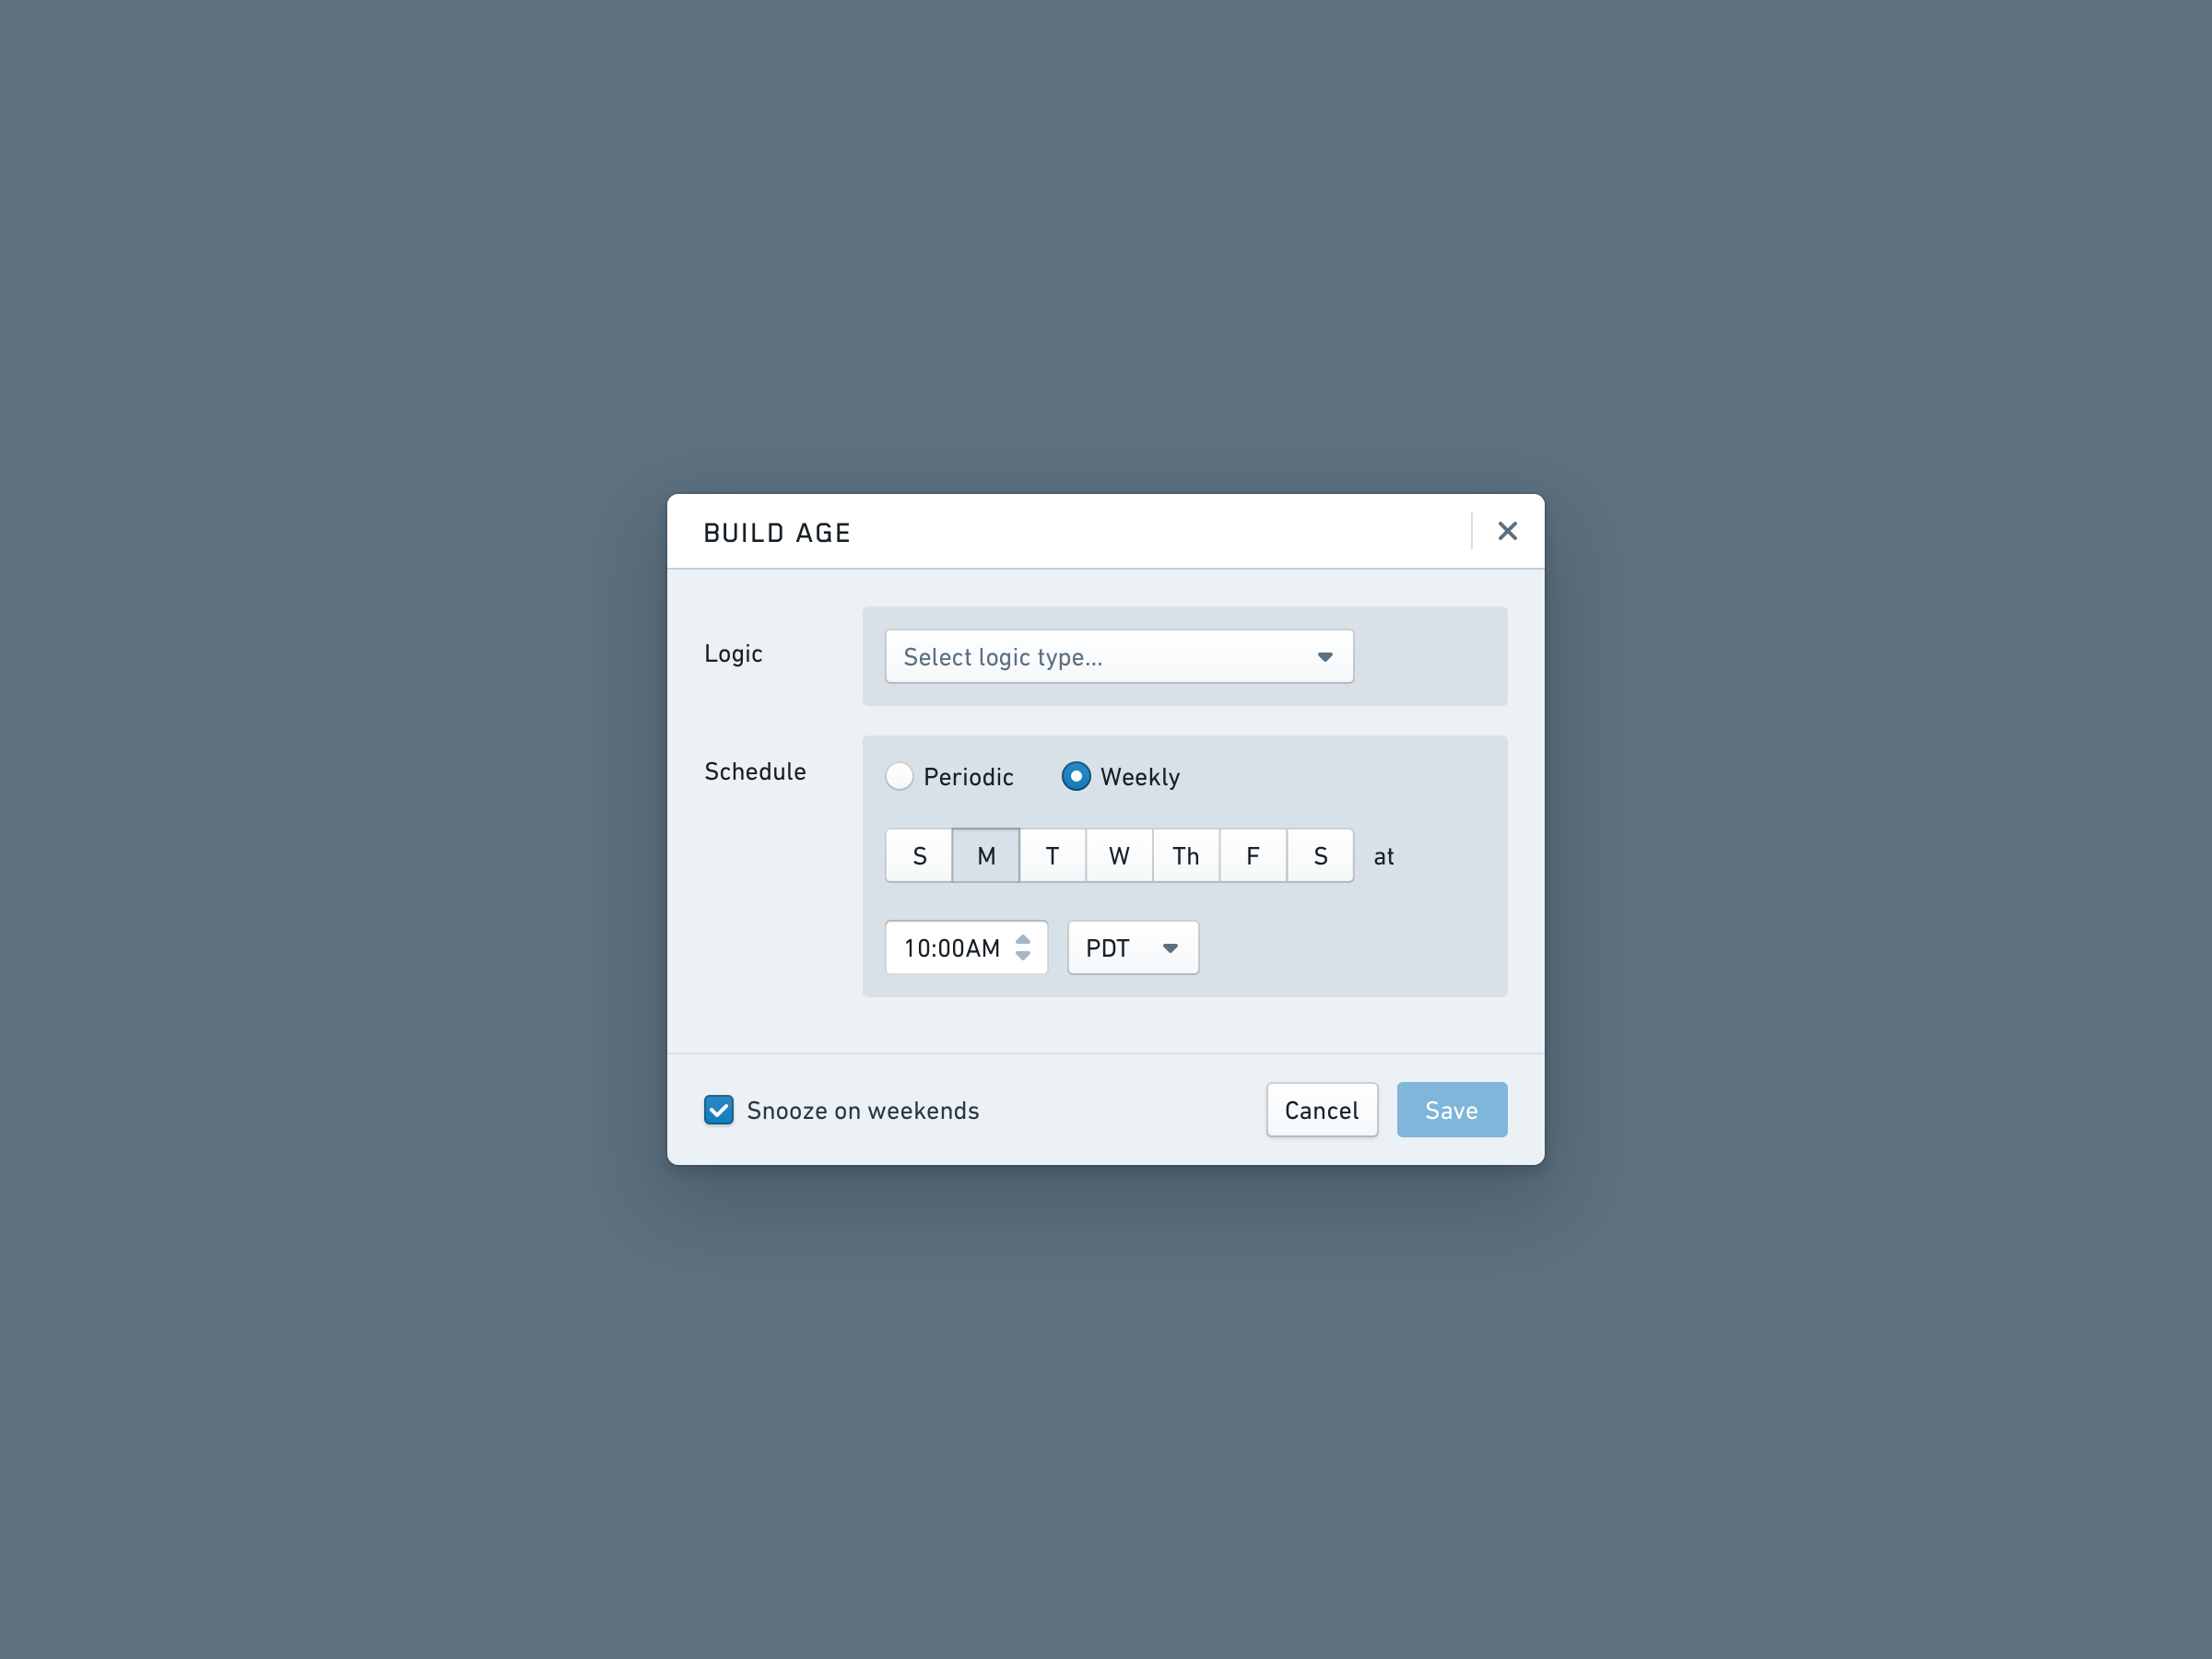
The most challenging part of designing Data Health was the process of adding and editing checks. It was not only a challenge to balance visually dense components into a modal, but also a challenge to communicate to the users the different ways of validating a check by translating technical, mathematical language that was easy to understand. Each check required proper attention in nailing the language and interactions right. Below are a few iterations of how the edit dialog evolved over time (final on the right).
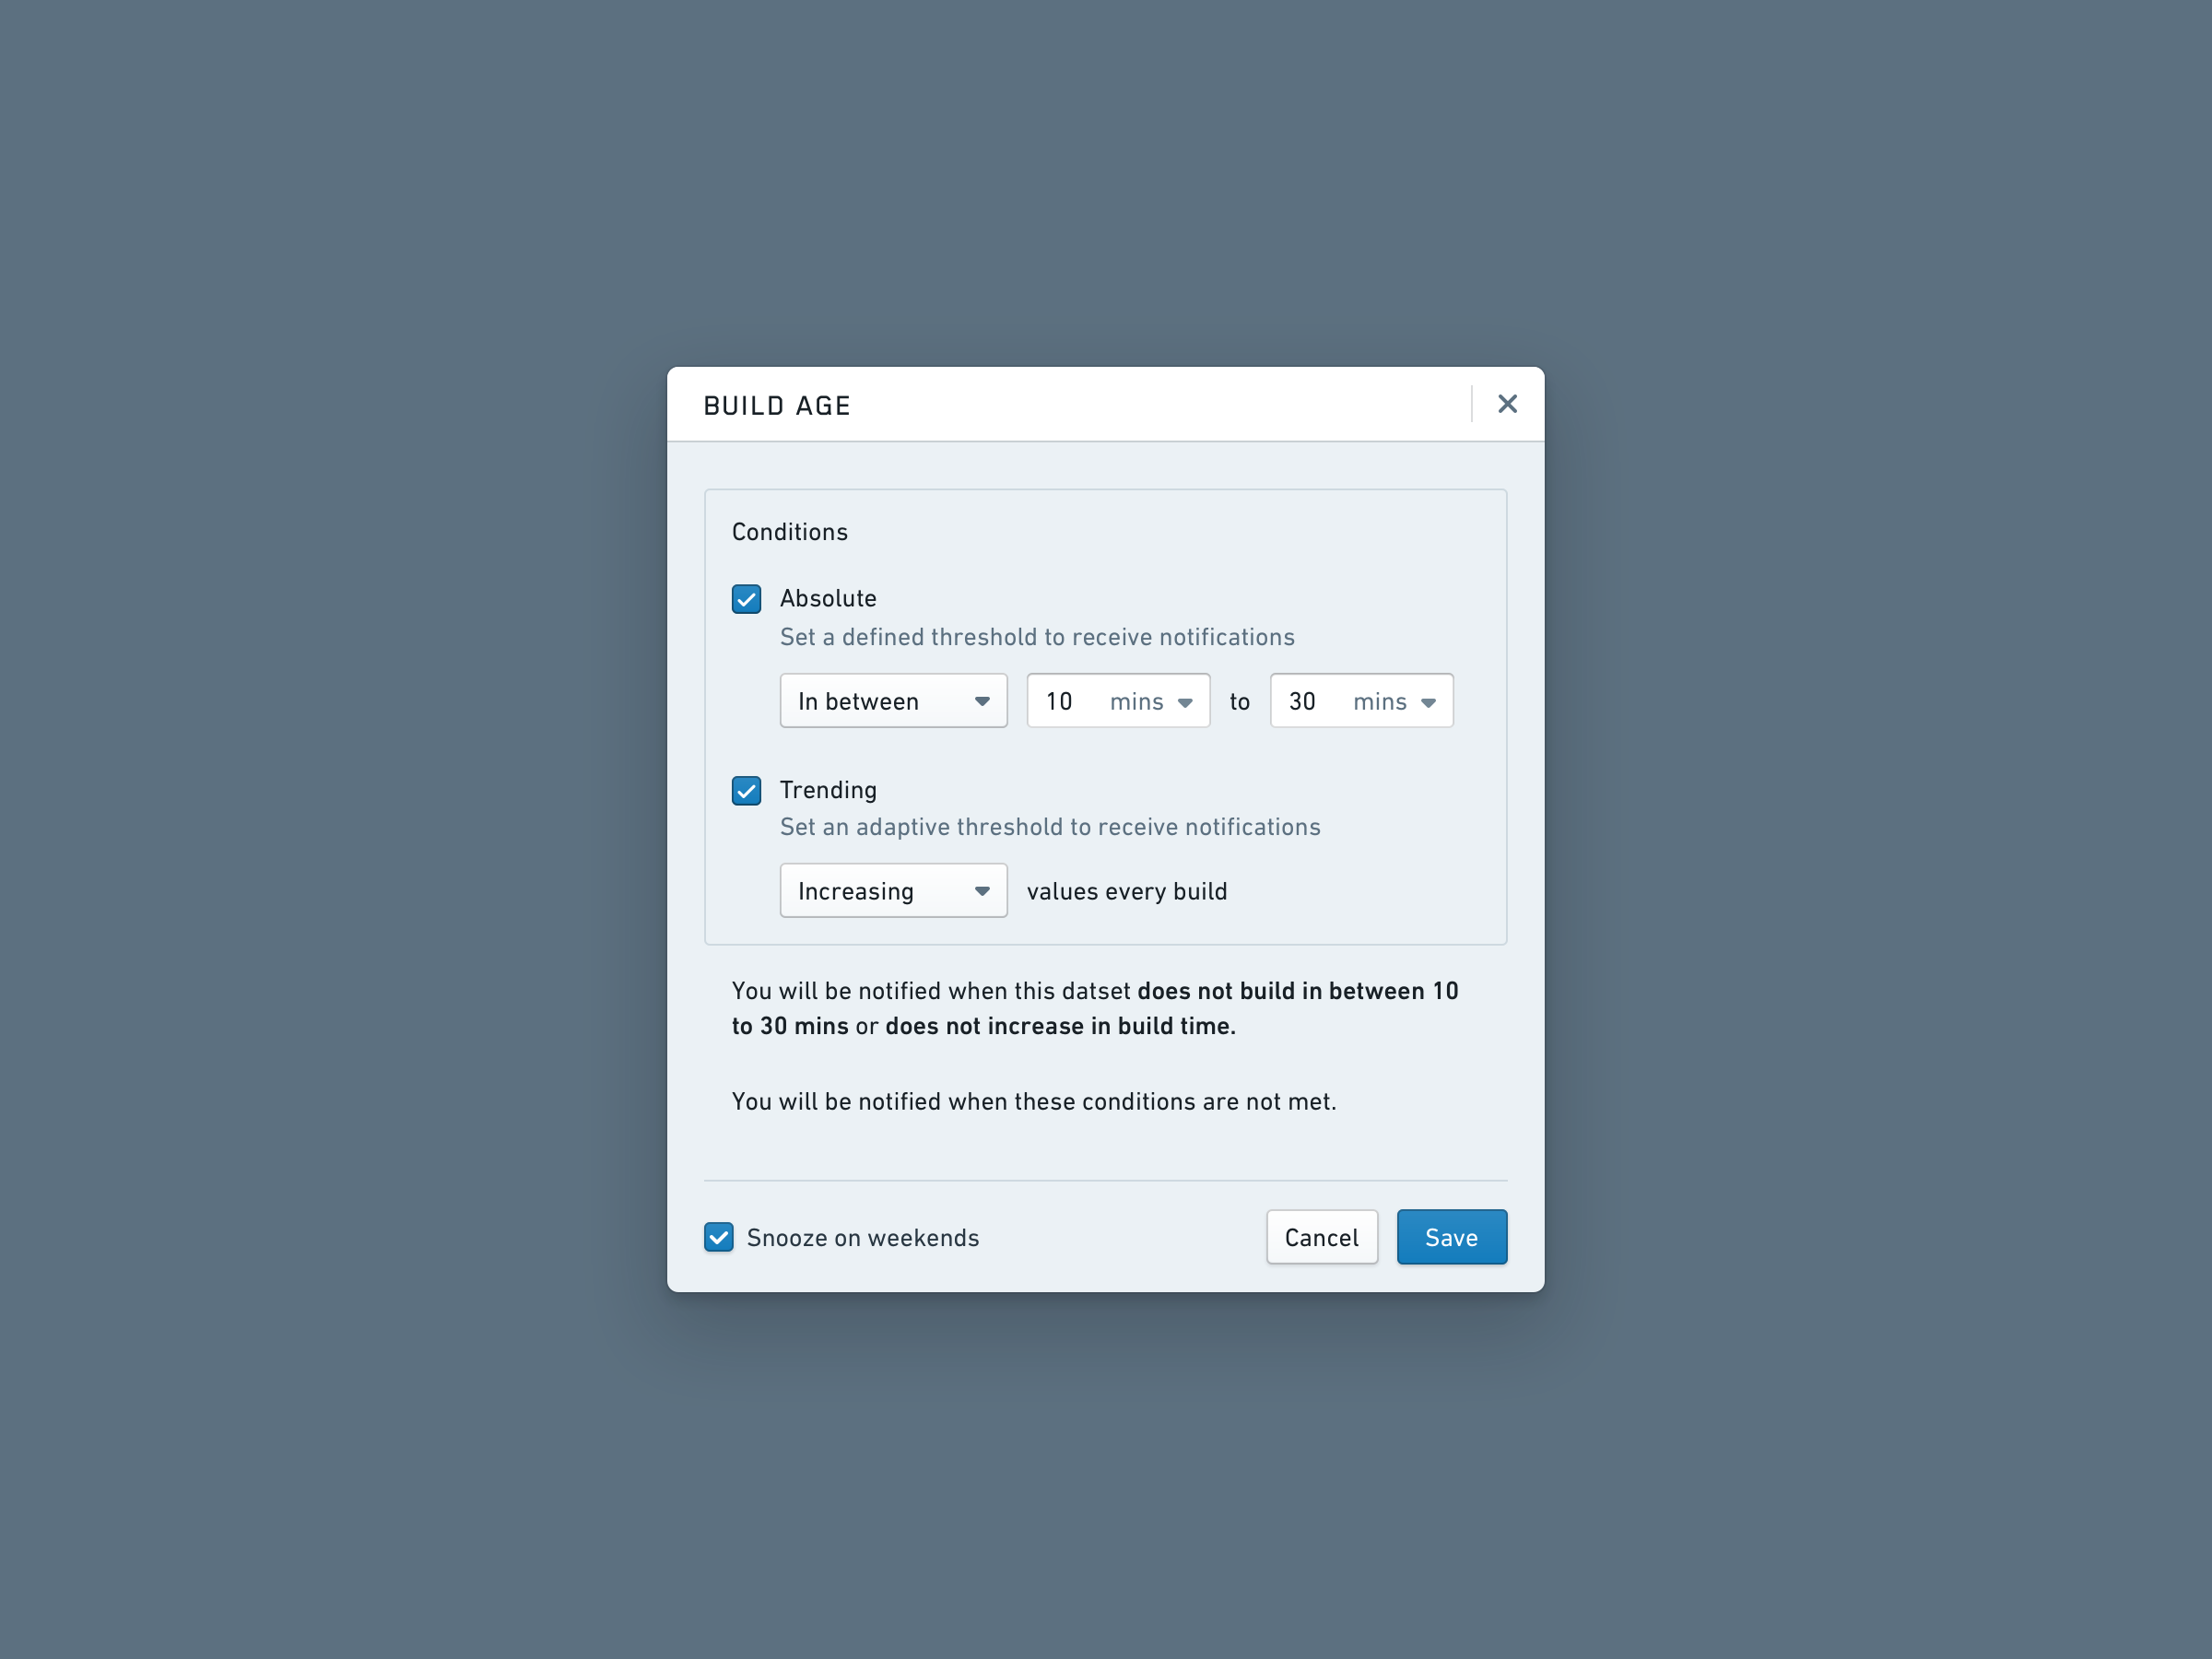
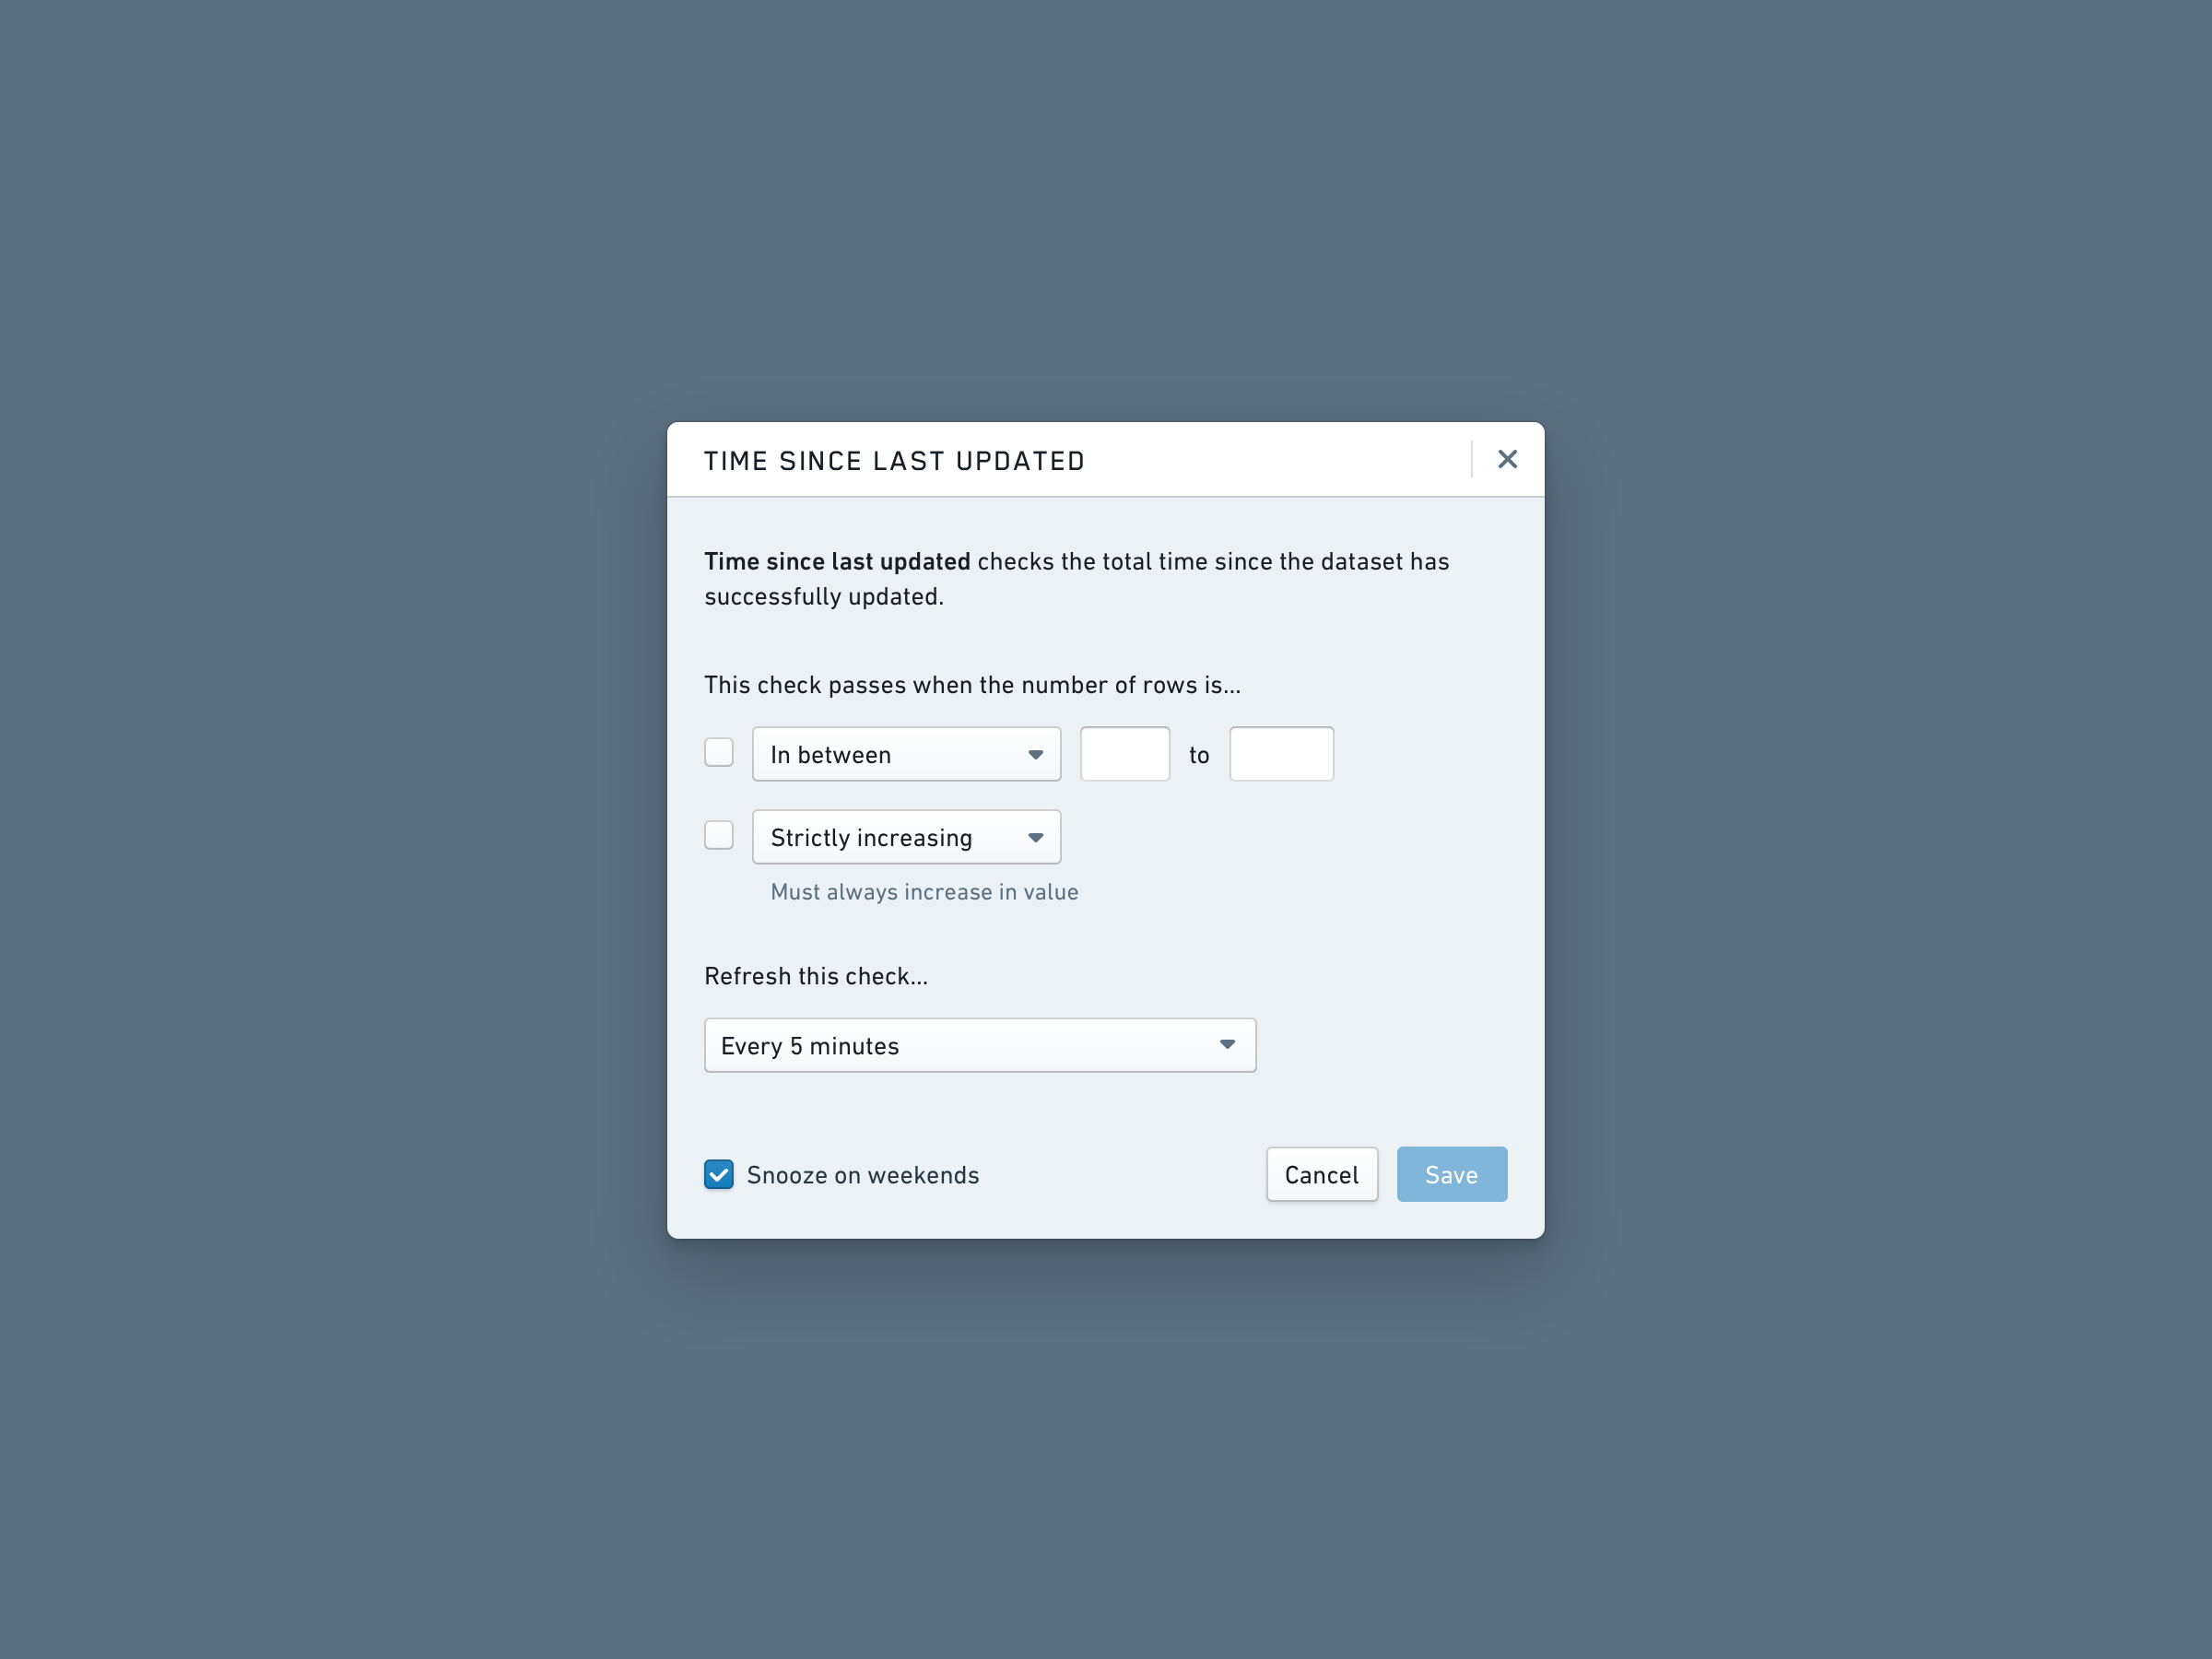
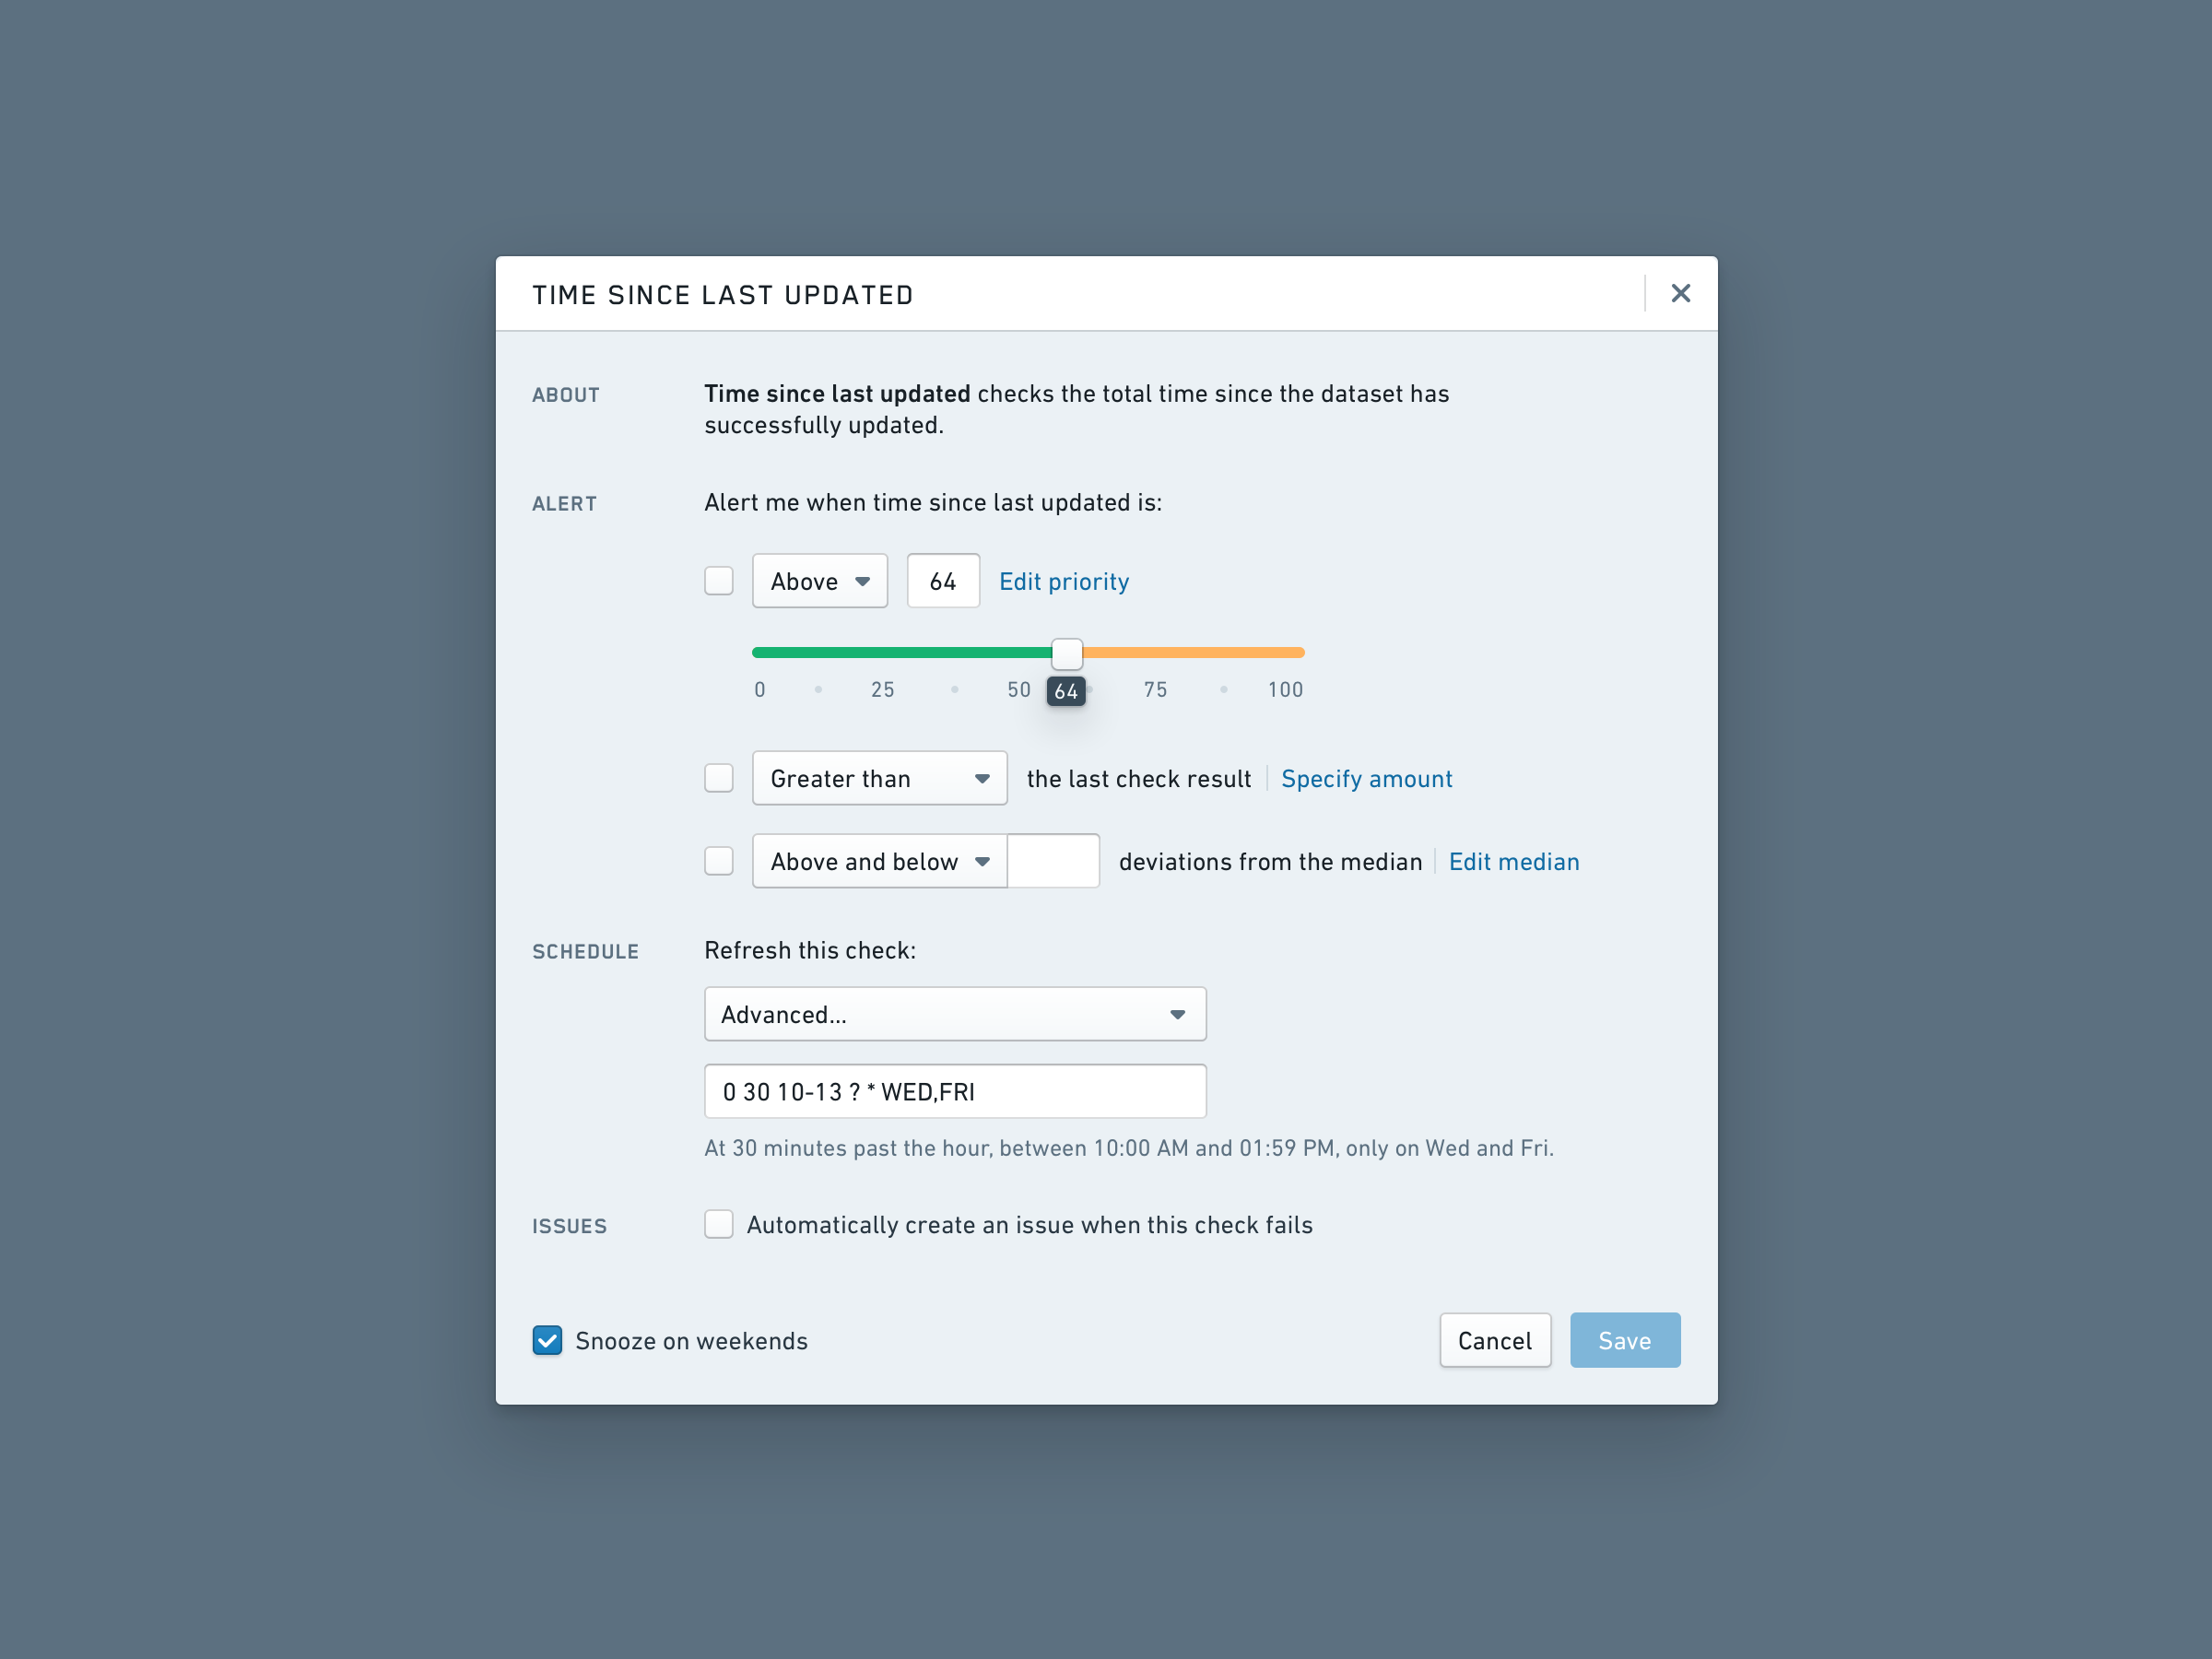
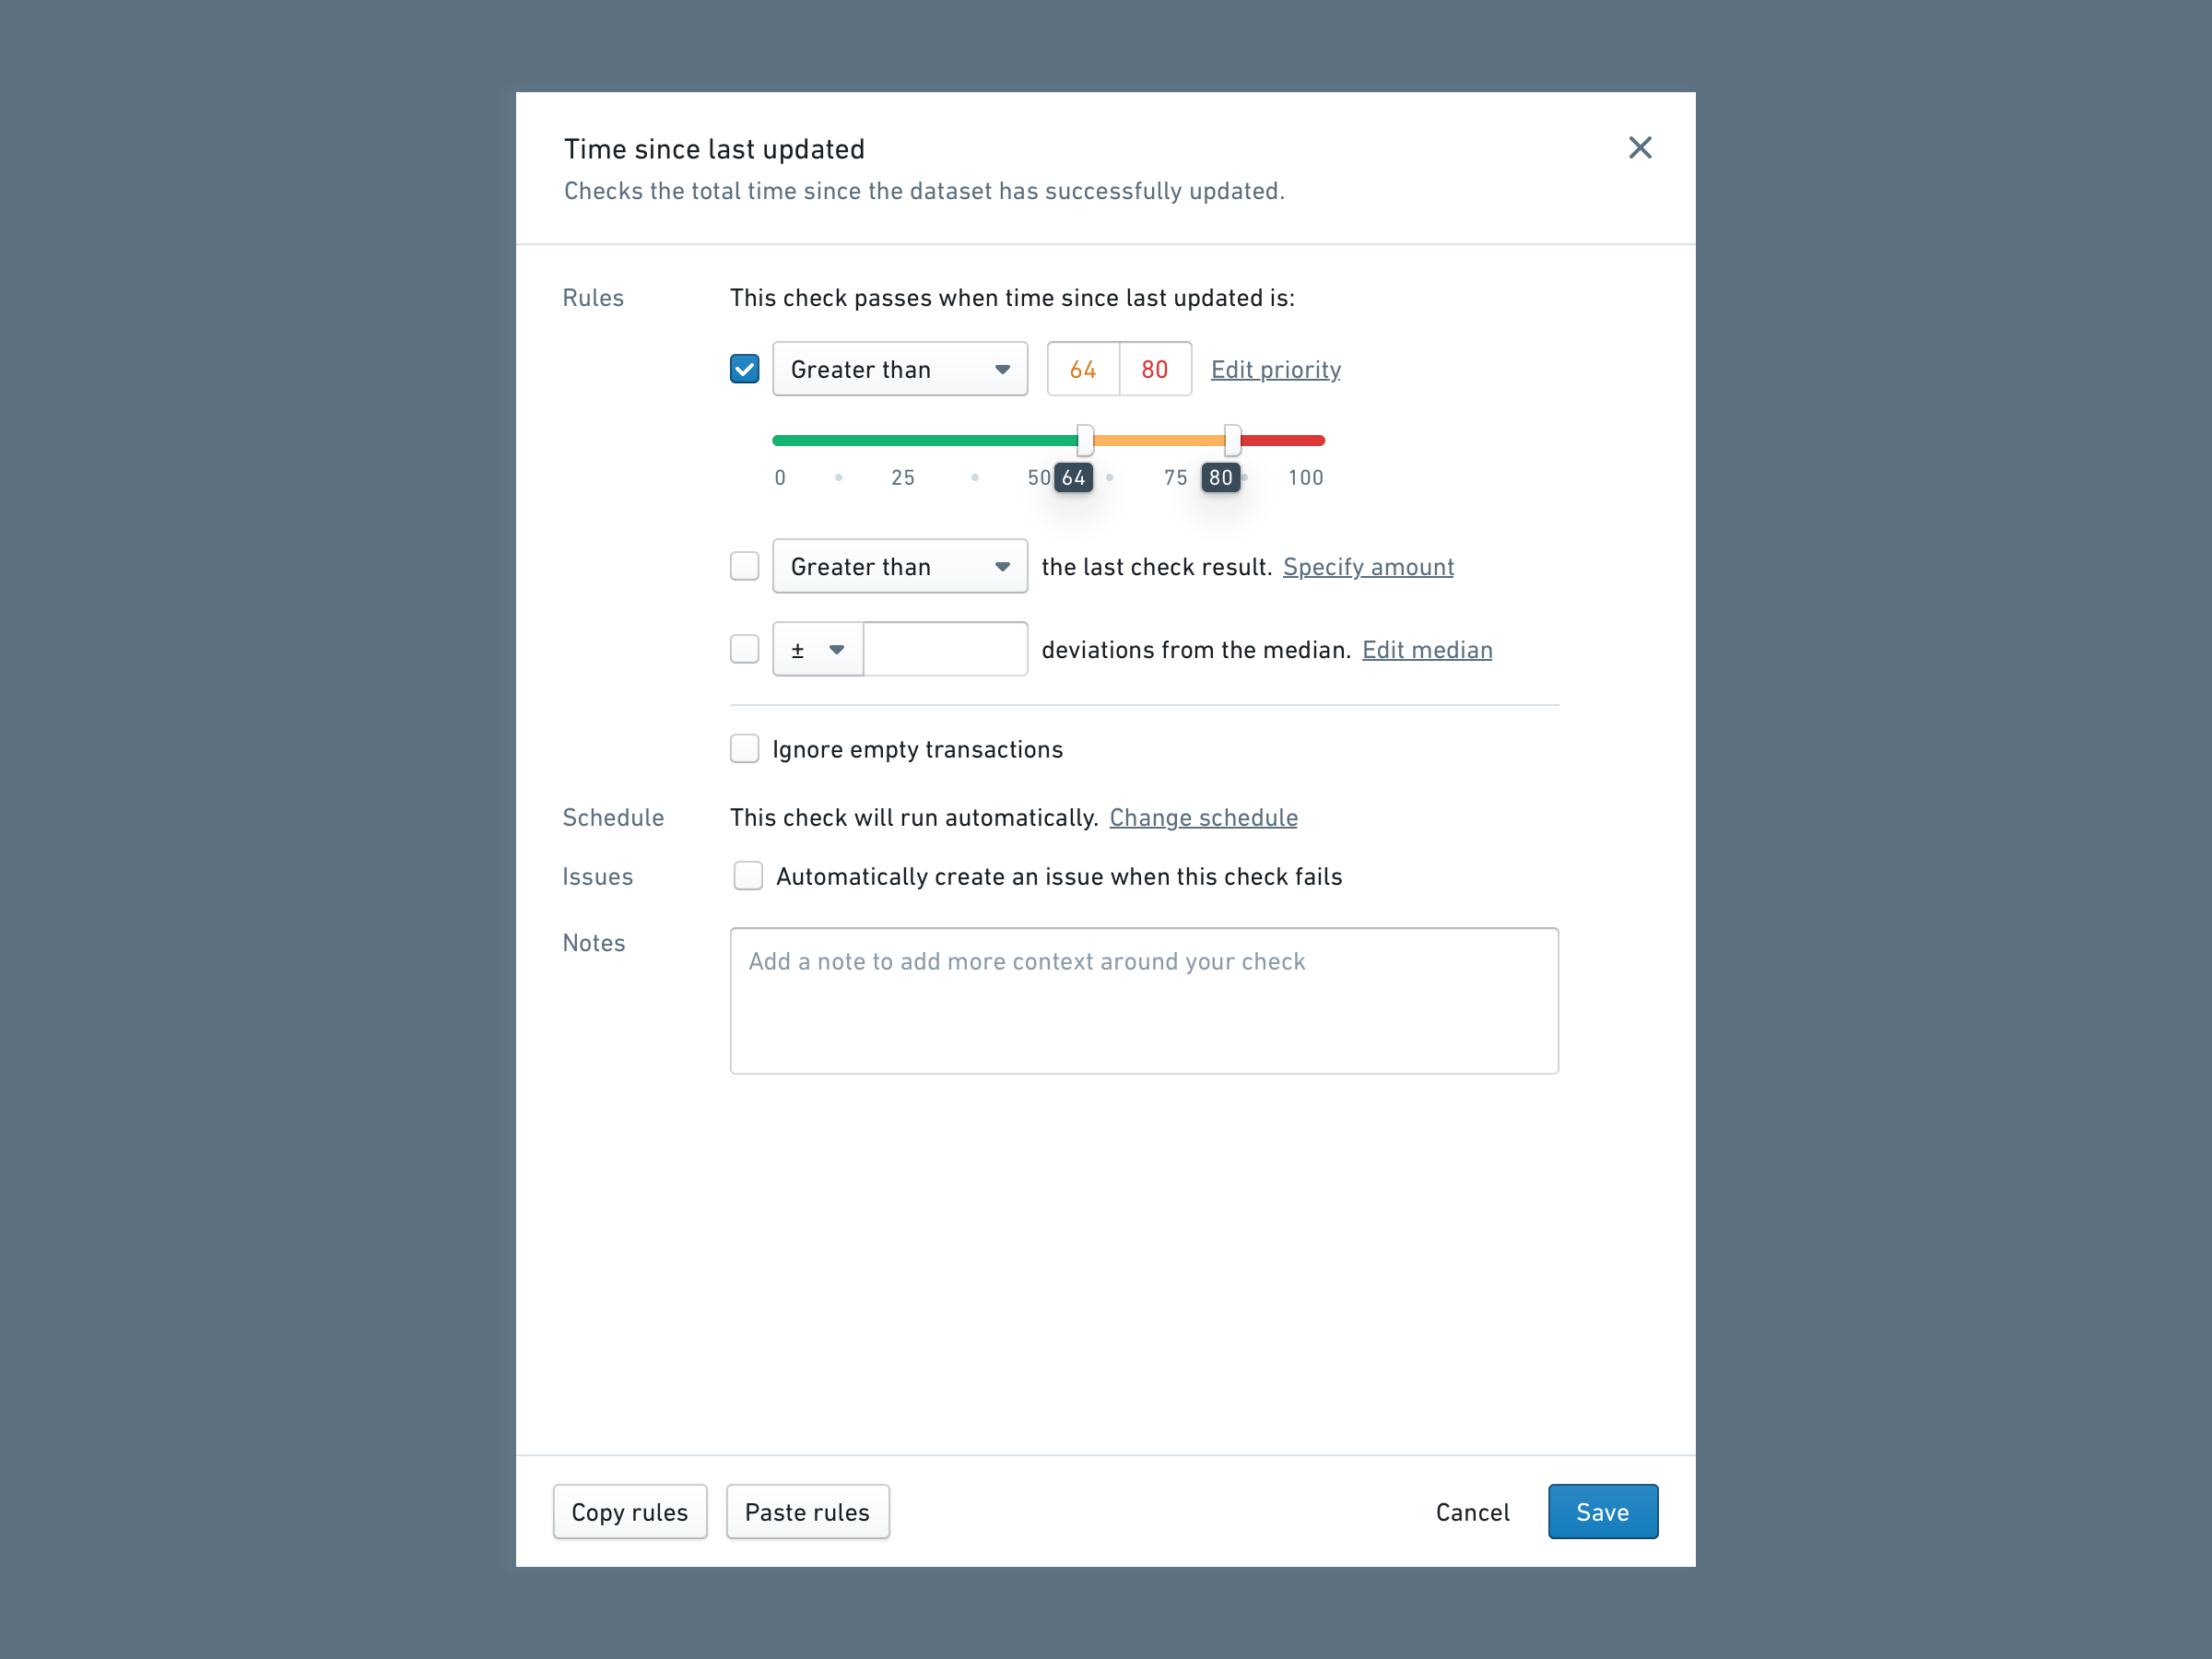
After we shipped Data Health, we realized that there needed to be a way of managing multiple checks in a single page (rather than fragmenting the experience within each dataset file). We designed a quick, simple overview page that housed a list of all checks pipeline engineers would manage. It was first a generic list of recently ran checks with a few simple filters.
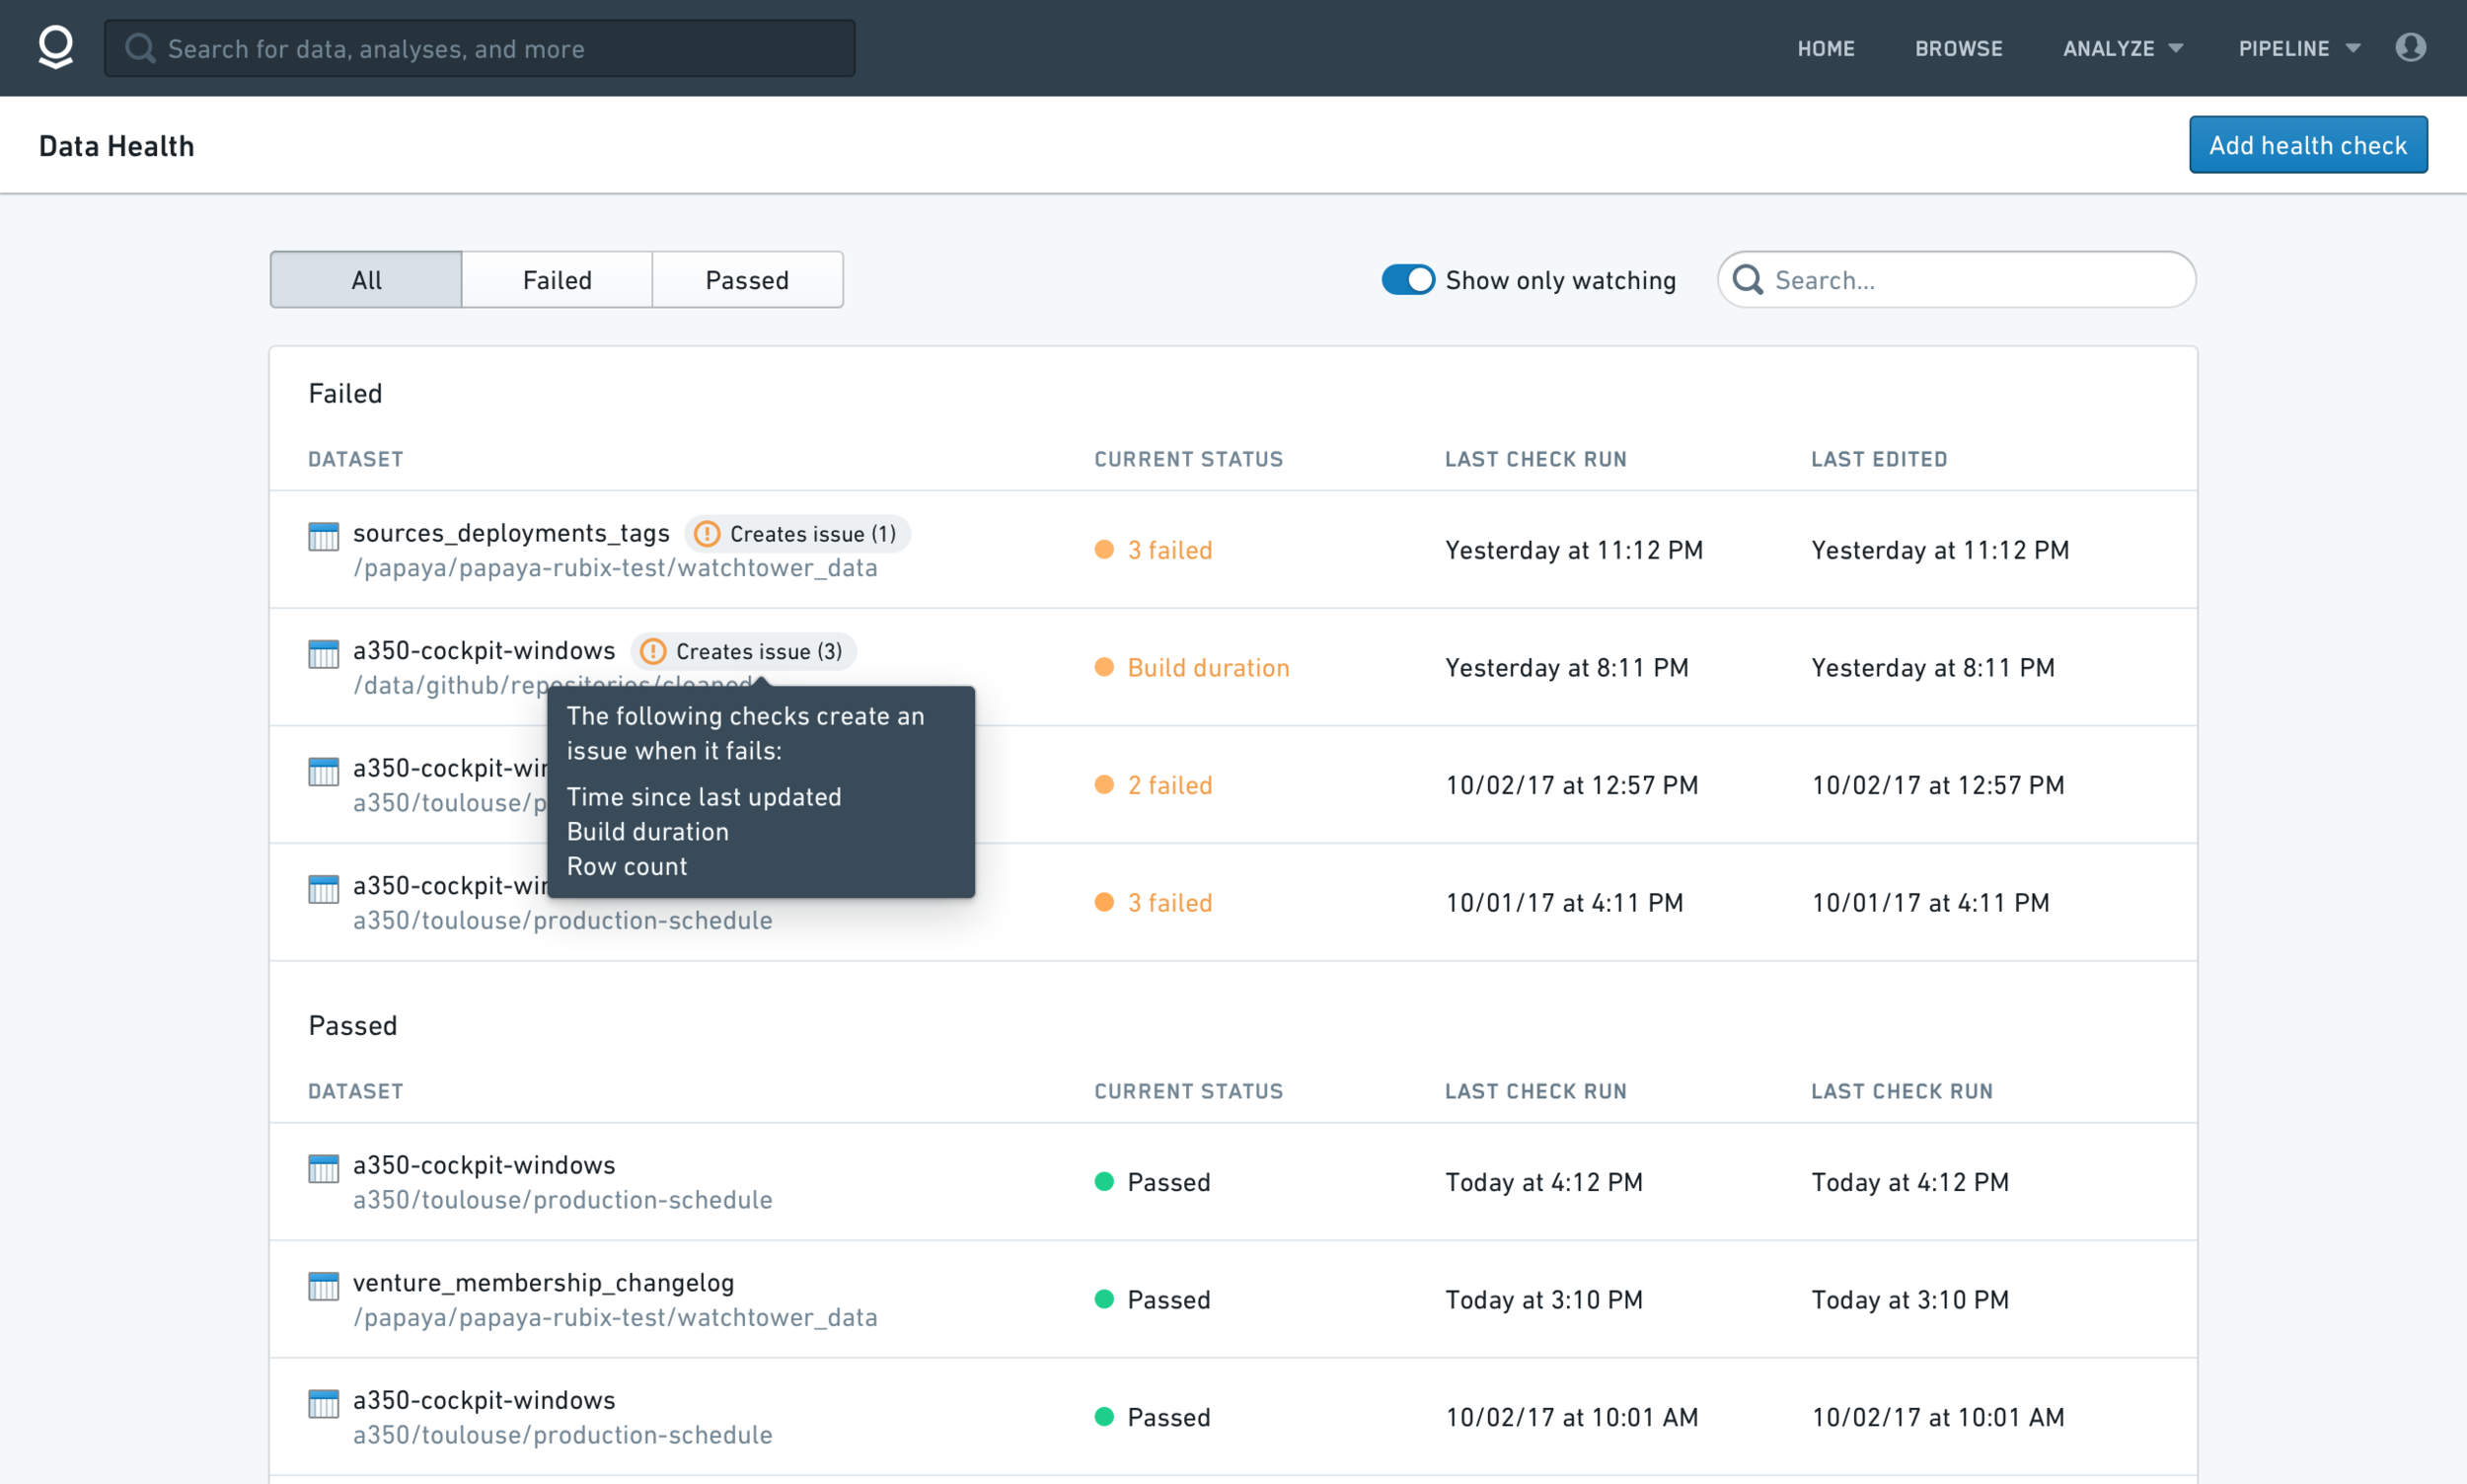
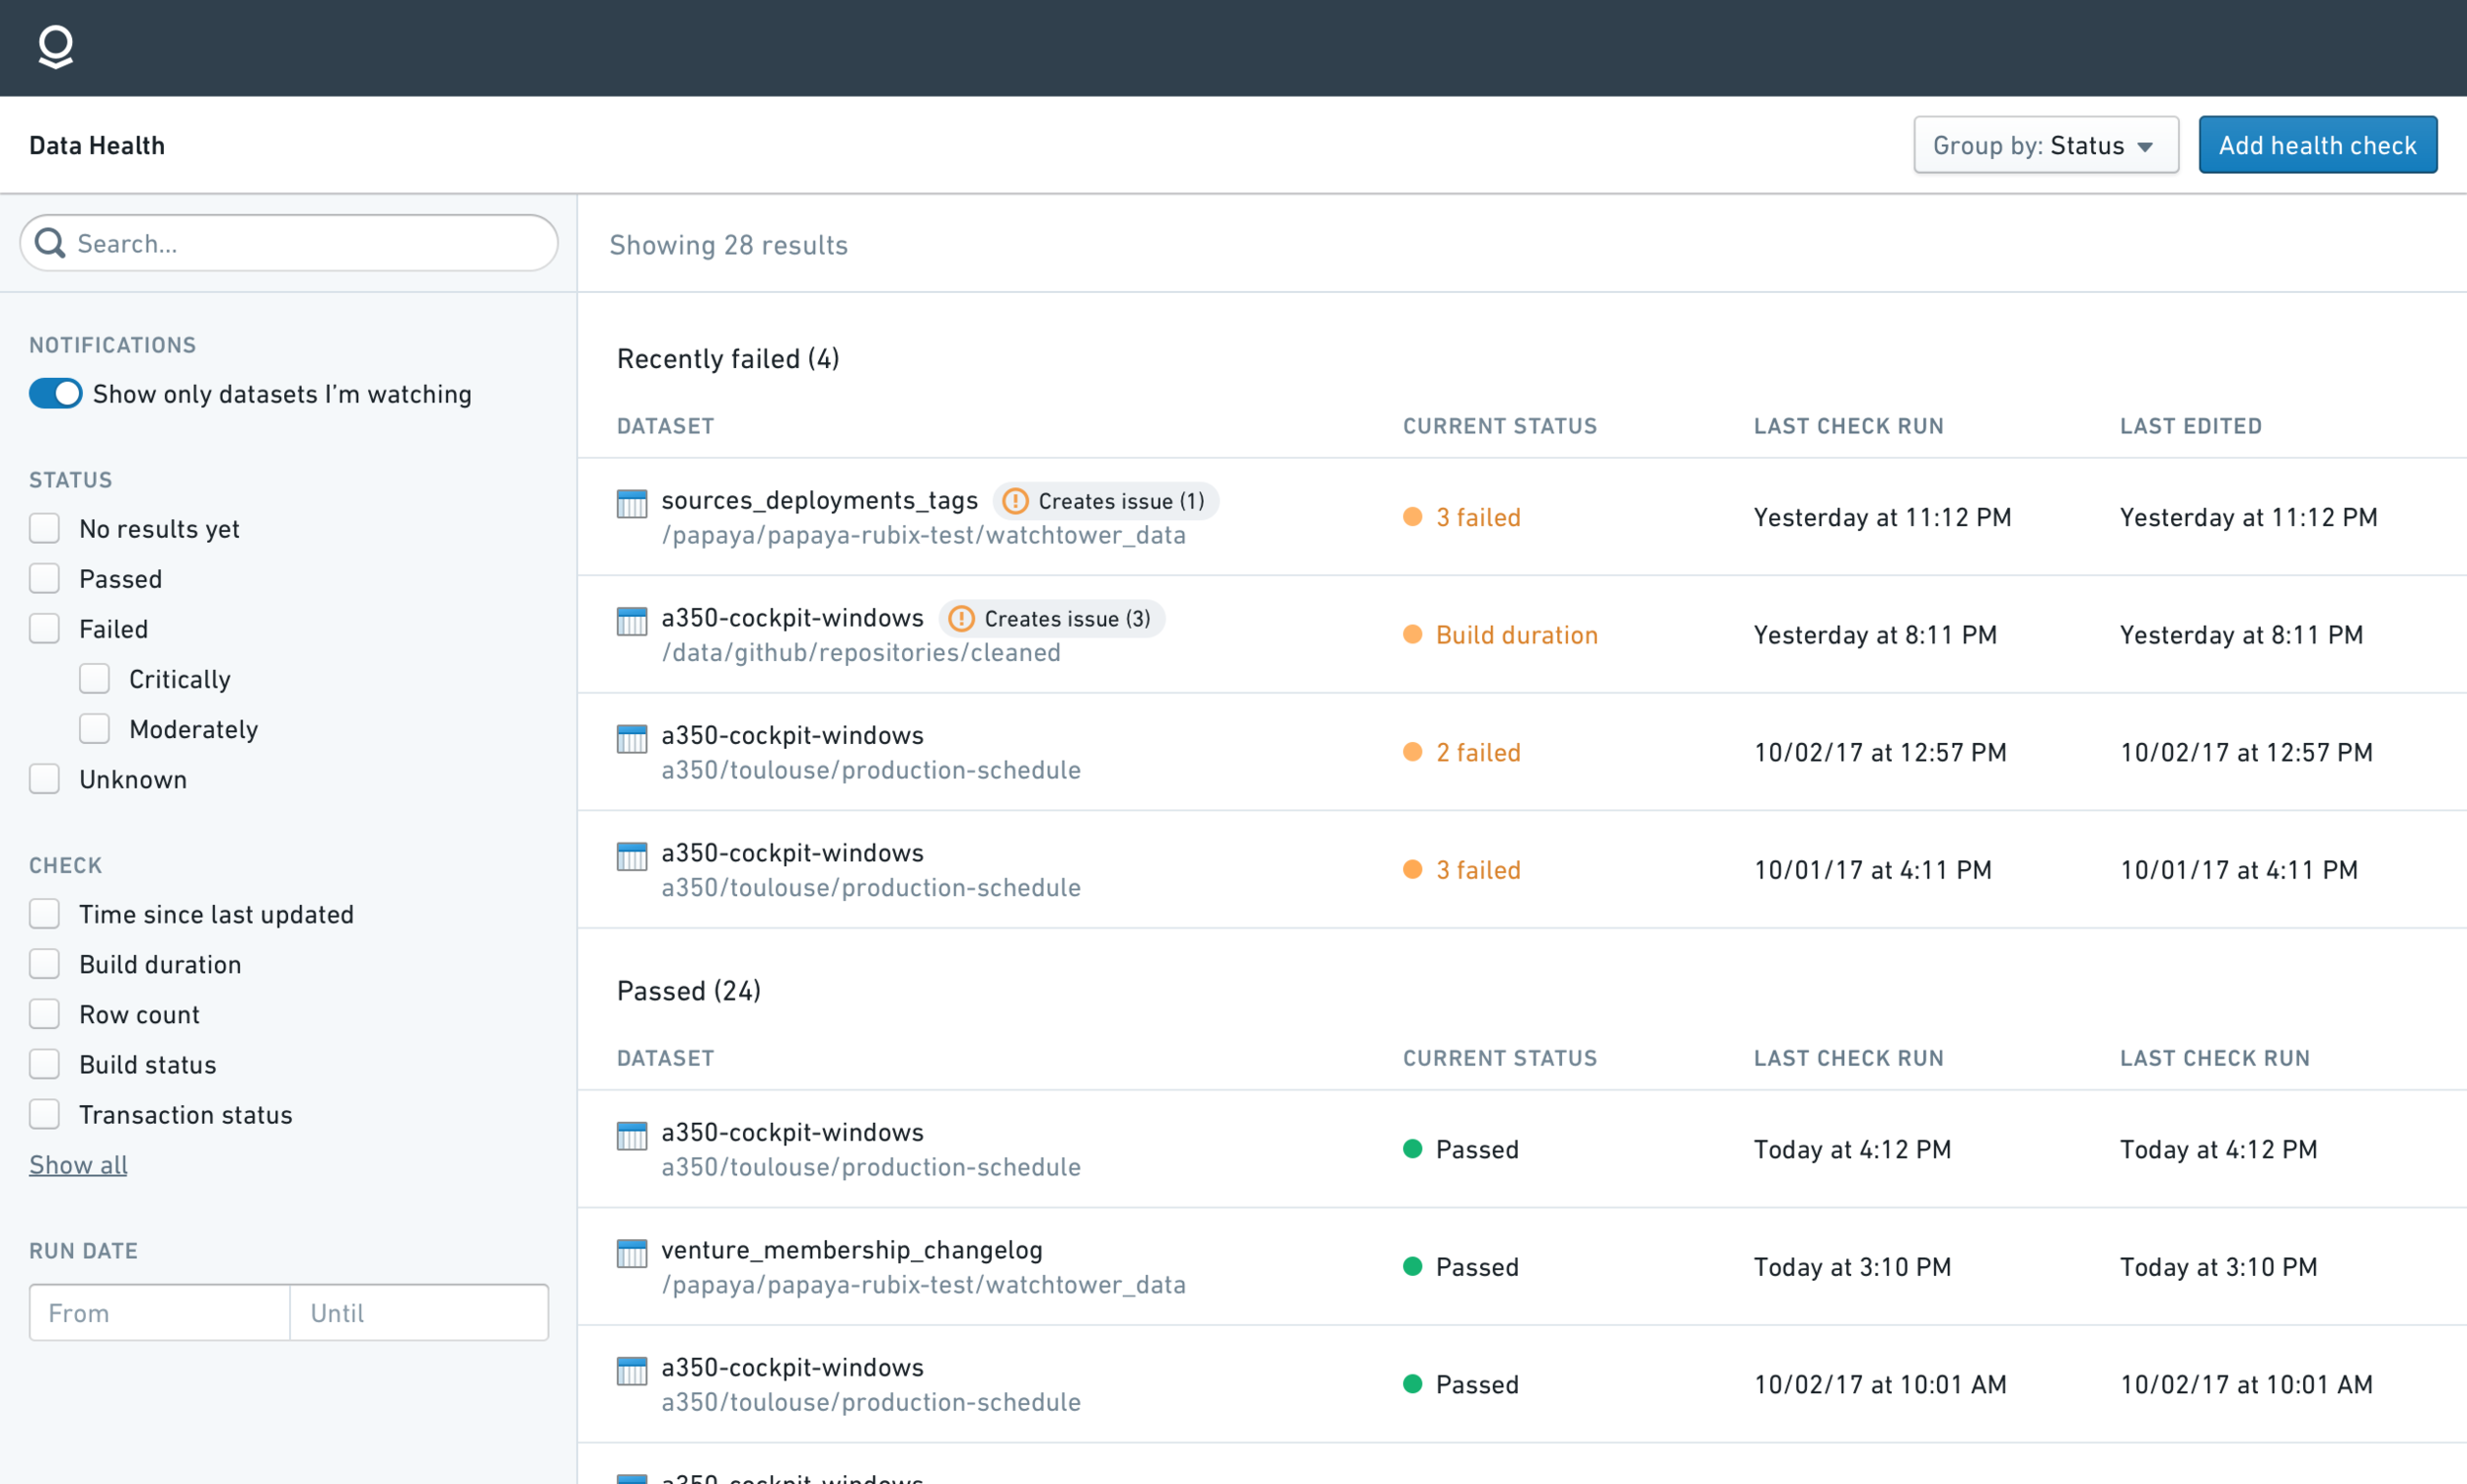
After some time, once usage began to pick up, we realized that the scale of health checks being managed was dramatically higher than we had initially expected. Users were managing more than 20,000 health checks. To address this, we re-designed and shipped a new version of the overview page with a set of more robust filters and sorting to better manage this workflow. Below is what the Data Health overview page looks like today.
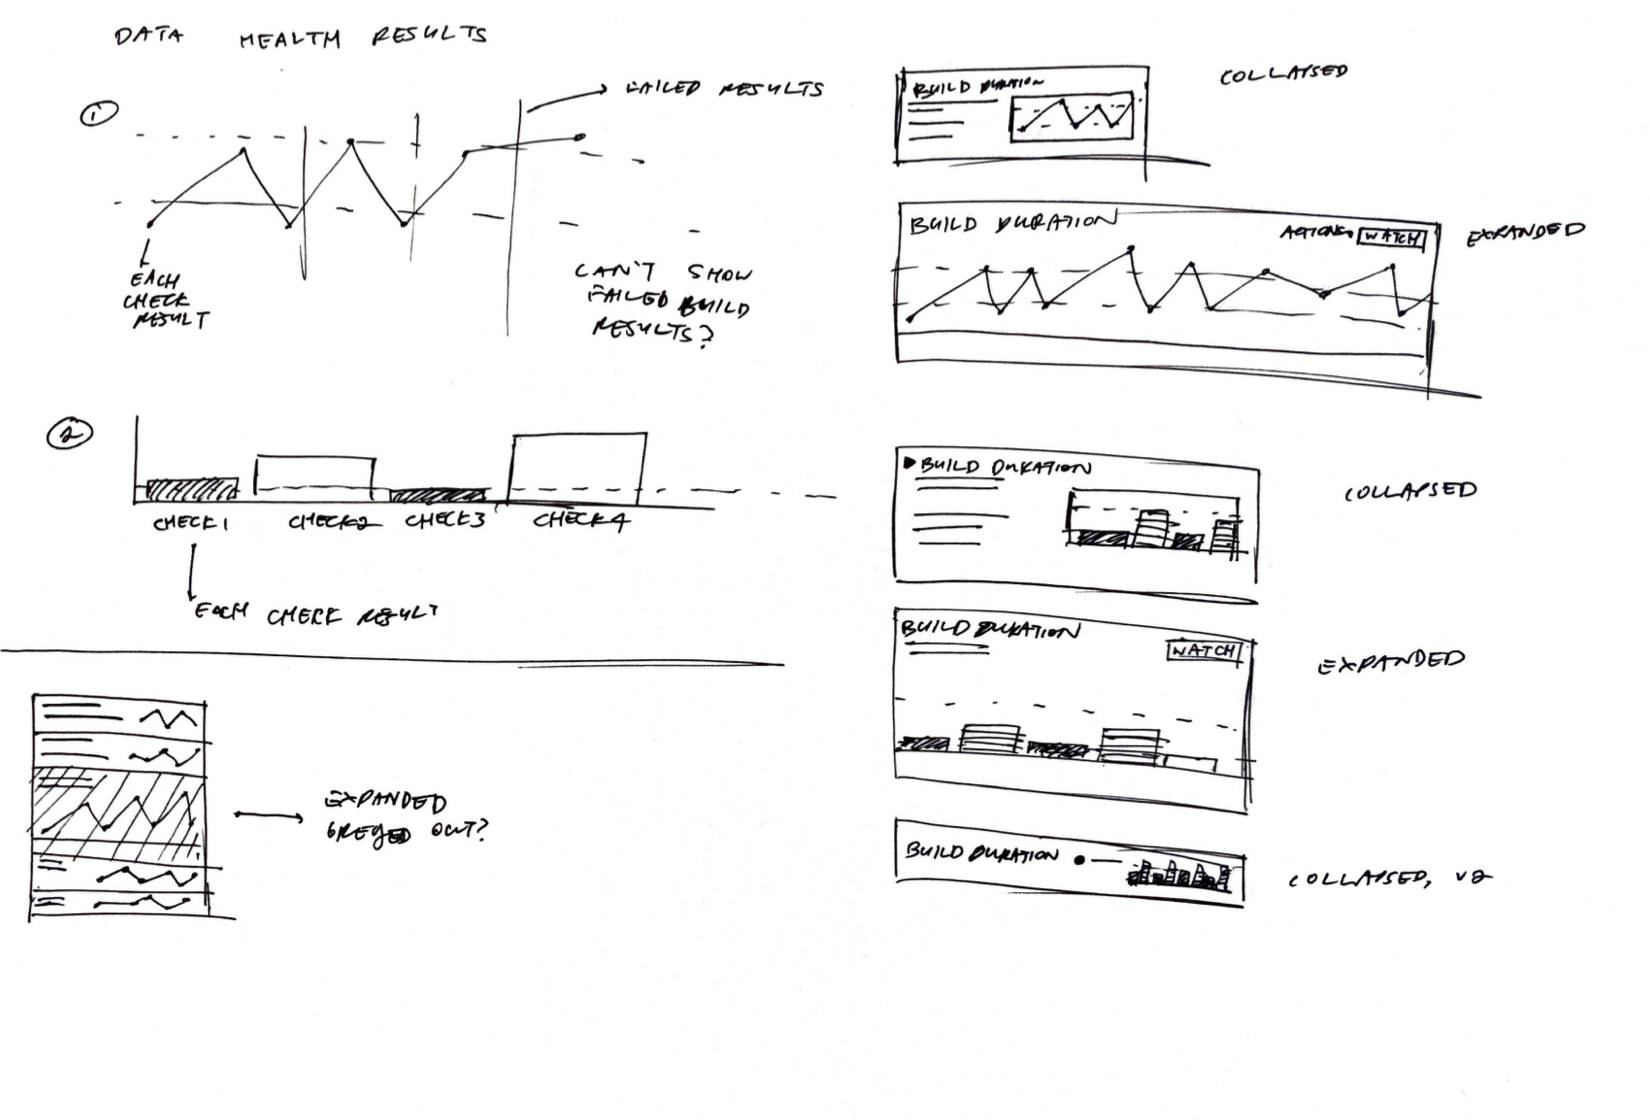
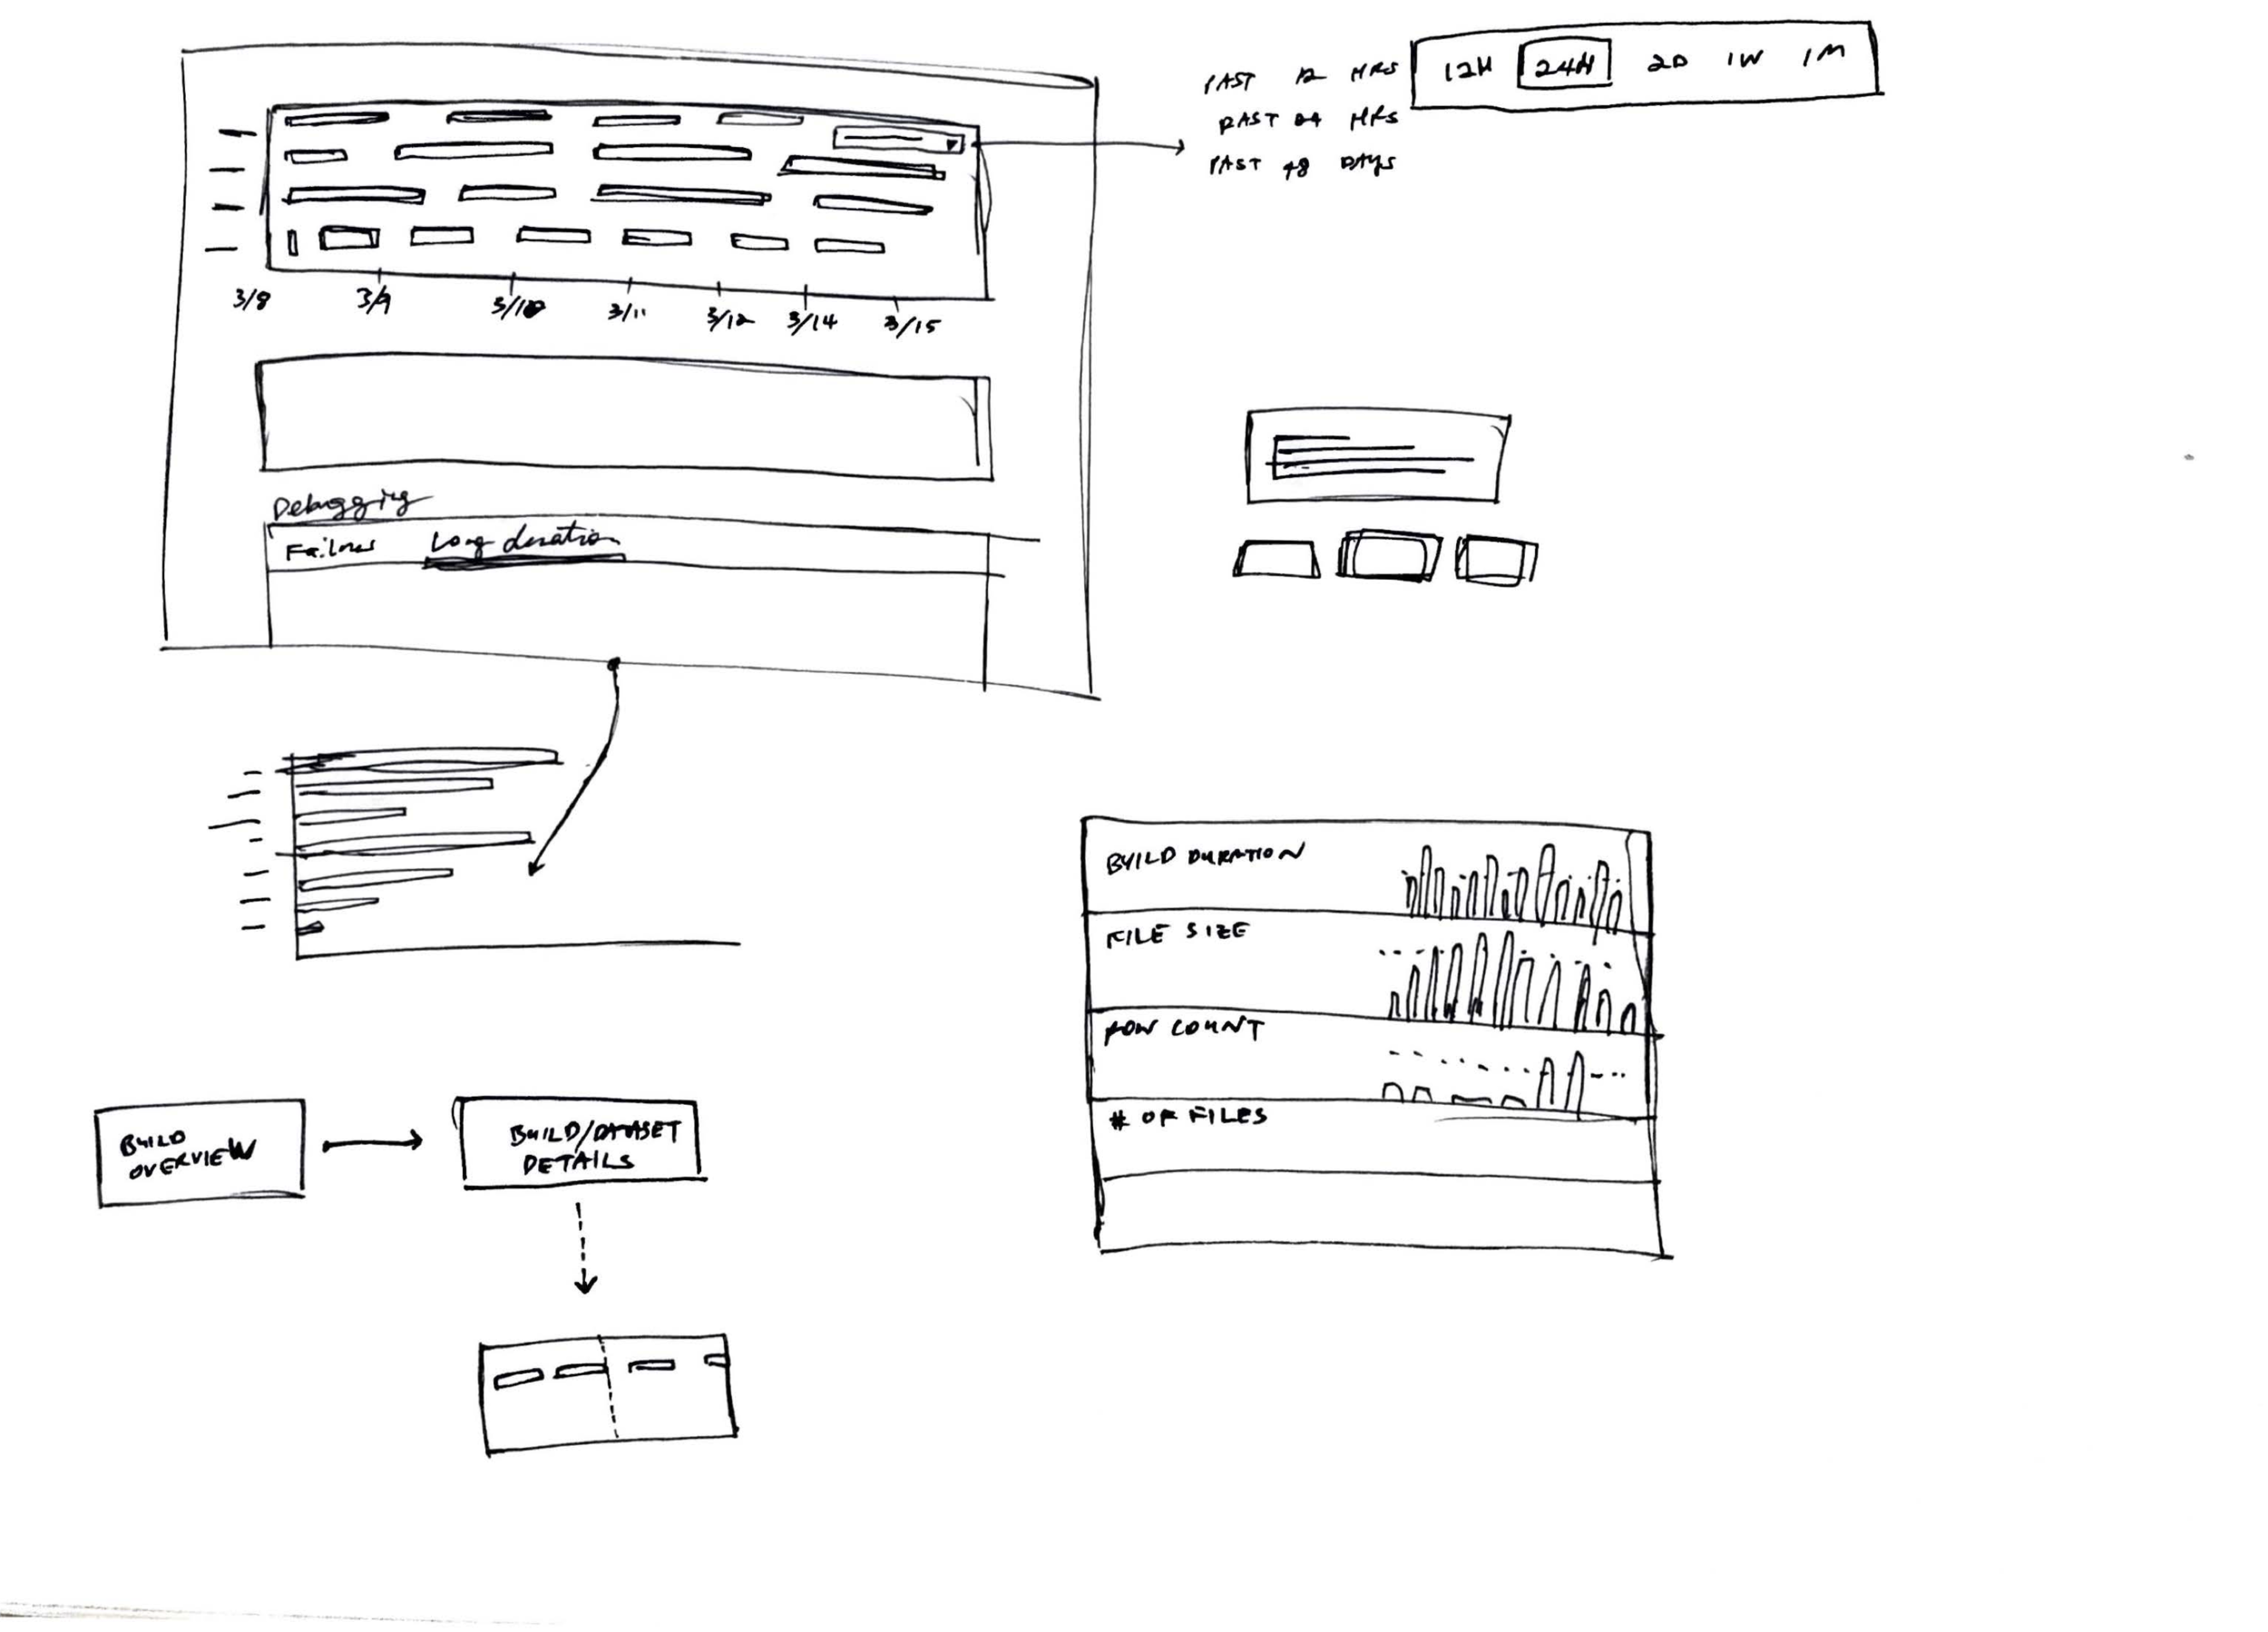
Last but not least, some early sketches of Data Health.
You can find additional related write-ups about Data Health and other products I work on at Palantir here.